Fig. 2.
Download original image
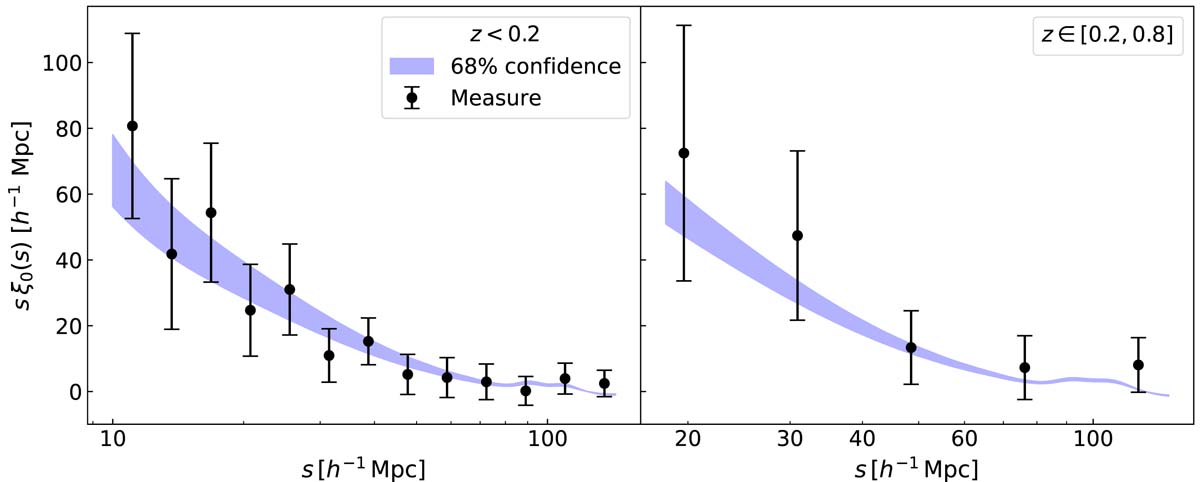
Redshift-space 2PCF monopole (black dots) of the Planck clusters in the spatial range s ∈ [10, 150] h−1 Mpc for z < 0.2 (left plot), and s ∈ [15, 150] h−1 Mpc for z ∈ [0.2, 0.8] (right plot). The blue bands represent the model 68% confidence level derived from the posterior of the free parameters considered in the analysis described in Sect. 4.1.
Current usage metrics show cumulative count of Article Views (full-text article views including HTML views, PDF and ePub downloads, according to the available data) and Abstracts Views on Vision4Press platform.
Data correspond to usage on the plateform after 2015. The current usage metrics is available 48-96 hours after online publication and is updated daily on week days.
Initial download of the metrics may take a while.