Open Access
Fig. 1.
Download original image
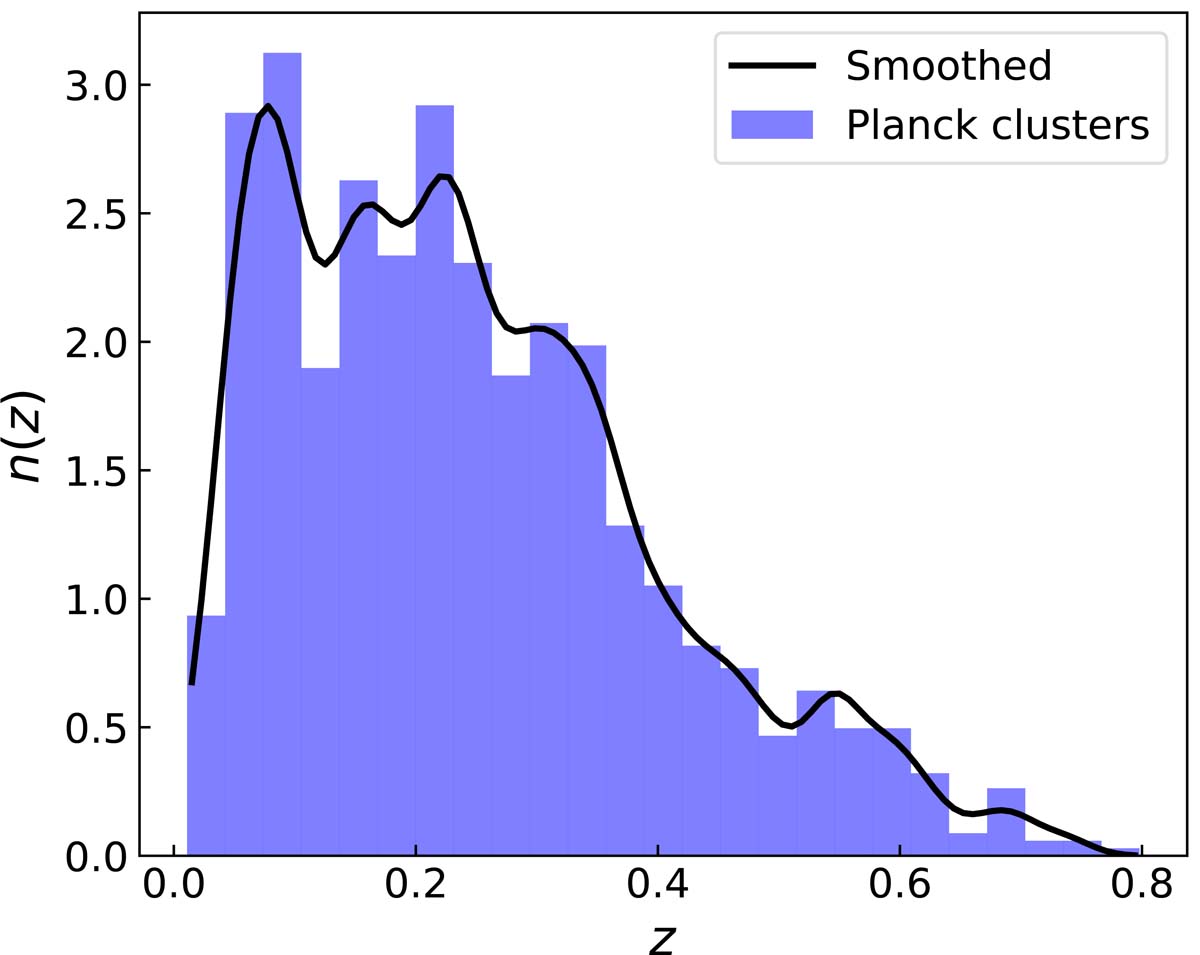
Redshift distribution n(z) of the galaxy clusters considered in the analysis. The blue histogram shows the observed binned n(z), and the black curve represents n(z) smoothed with a Gaussian kernel (with an rms equal to 0.02) that was used to build up the random catalogue.
Current usage metrics show cumulative count of Article Views (full-text article views including HTML views, PDF and ePub downloads, according to the available data) and Abstracts Views on Vision4Press platform.
Data correspond to usage on the plateform after 2015. The current usage metrics is available 48-96 hours after online publication and is updated daily on week days.
Initial download of the metrics may take a while.