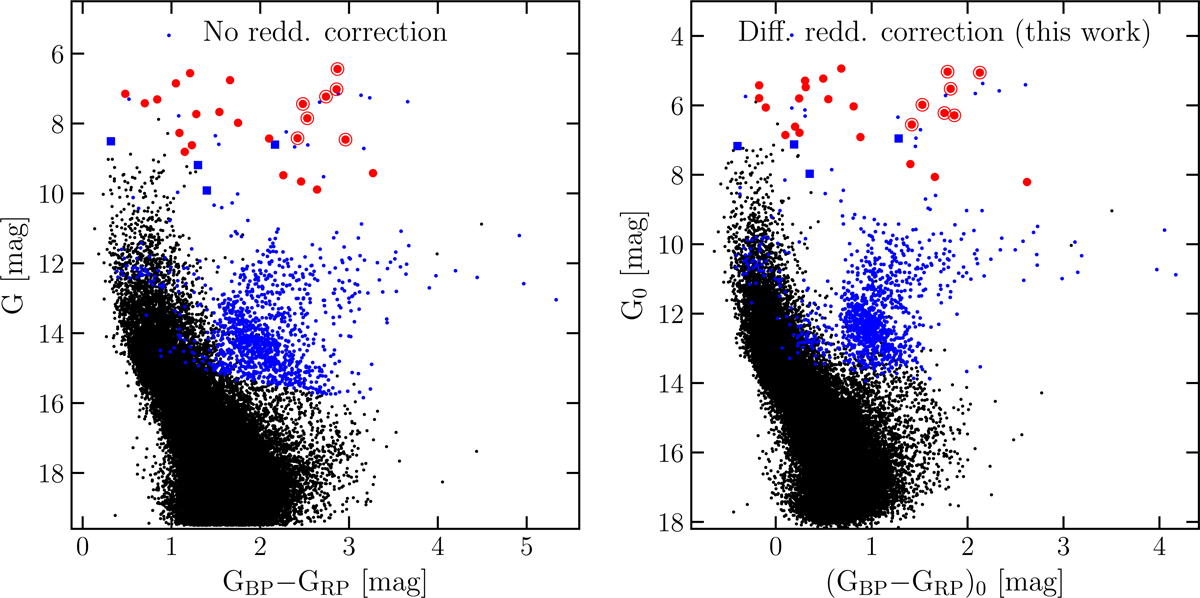
Fig. 7.
Download original image
Observed (left panel) and differential reddening corrected (right panel) CMD for the full catalog. In blue we show stars with LOS velocity measurements from Gaia DR3 (big squares for stars considered in the LOS analysis), whereas in red are stars targeted by high-resolution spectroscopy. The subsample with chemical abundances is circled in red.
Current usage metrics show cumulative count of Article Views (full-text article views including HTML views, PDF and ePub downloads, according to the available data) and Abstracts Views on Vision4Press platform.
Data correspond to usage on the plateform after 2015. The current usage metrics is available 48-96 hours after online publication and is updated daily on week days.
Initial download of the metrics may take a while.