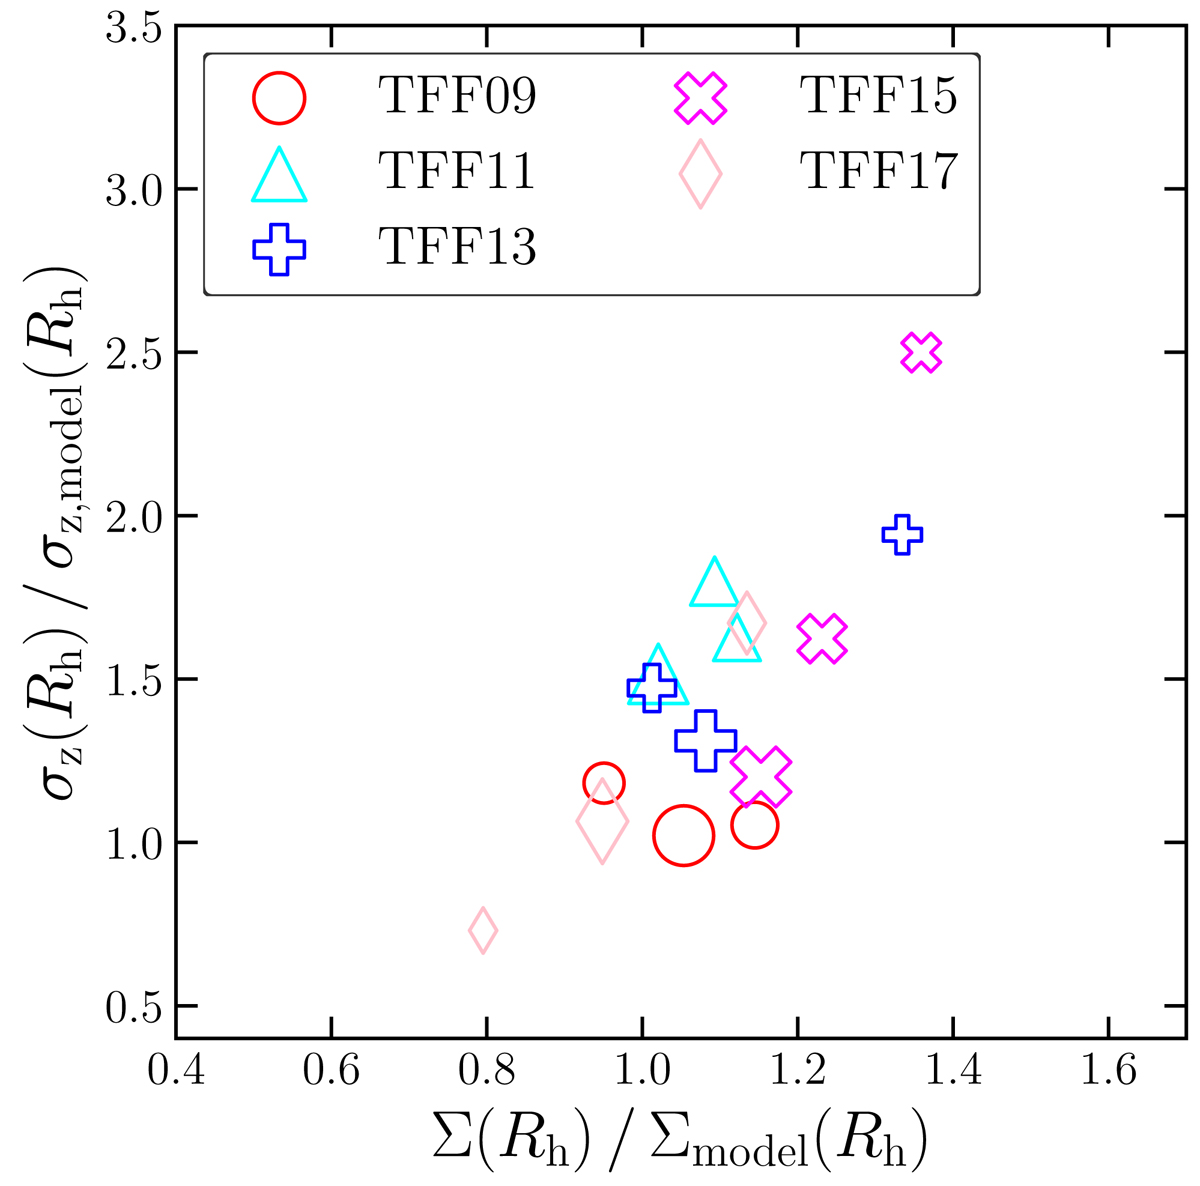
Fig. 25.

Download original image
One-dimensional velocity dispersion vs. projected surface density for the three largest clumps in each snapshot (see legend), each calculated at one projected half-mass radius. The 1D velocity dispersion and the projected surface density are both normalized by the value expected from the Plummer model best fitting the surface density profile. Point sizes are proportional to the total mass of each clump.
Current usage metrics show cumulative count of Article Views (full-text article views including HTML views, PDF and ePub downloads, according to the available data) and Abstracts Views on Vision4Press platform.
Data correspond to usage on the plateform after 2015. The current usage metrics is available 48-96 hours after online publication and is updated daily on week days.
Initial download of the metrics may take a while.


