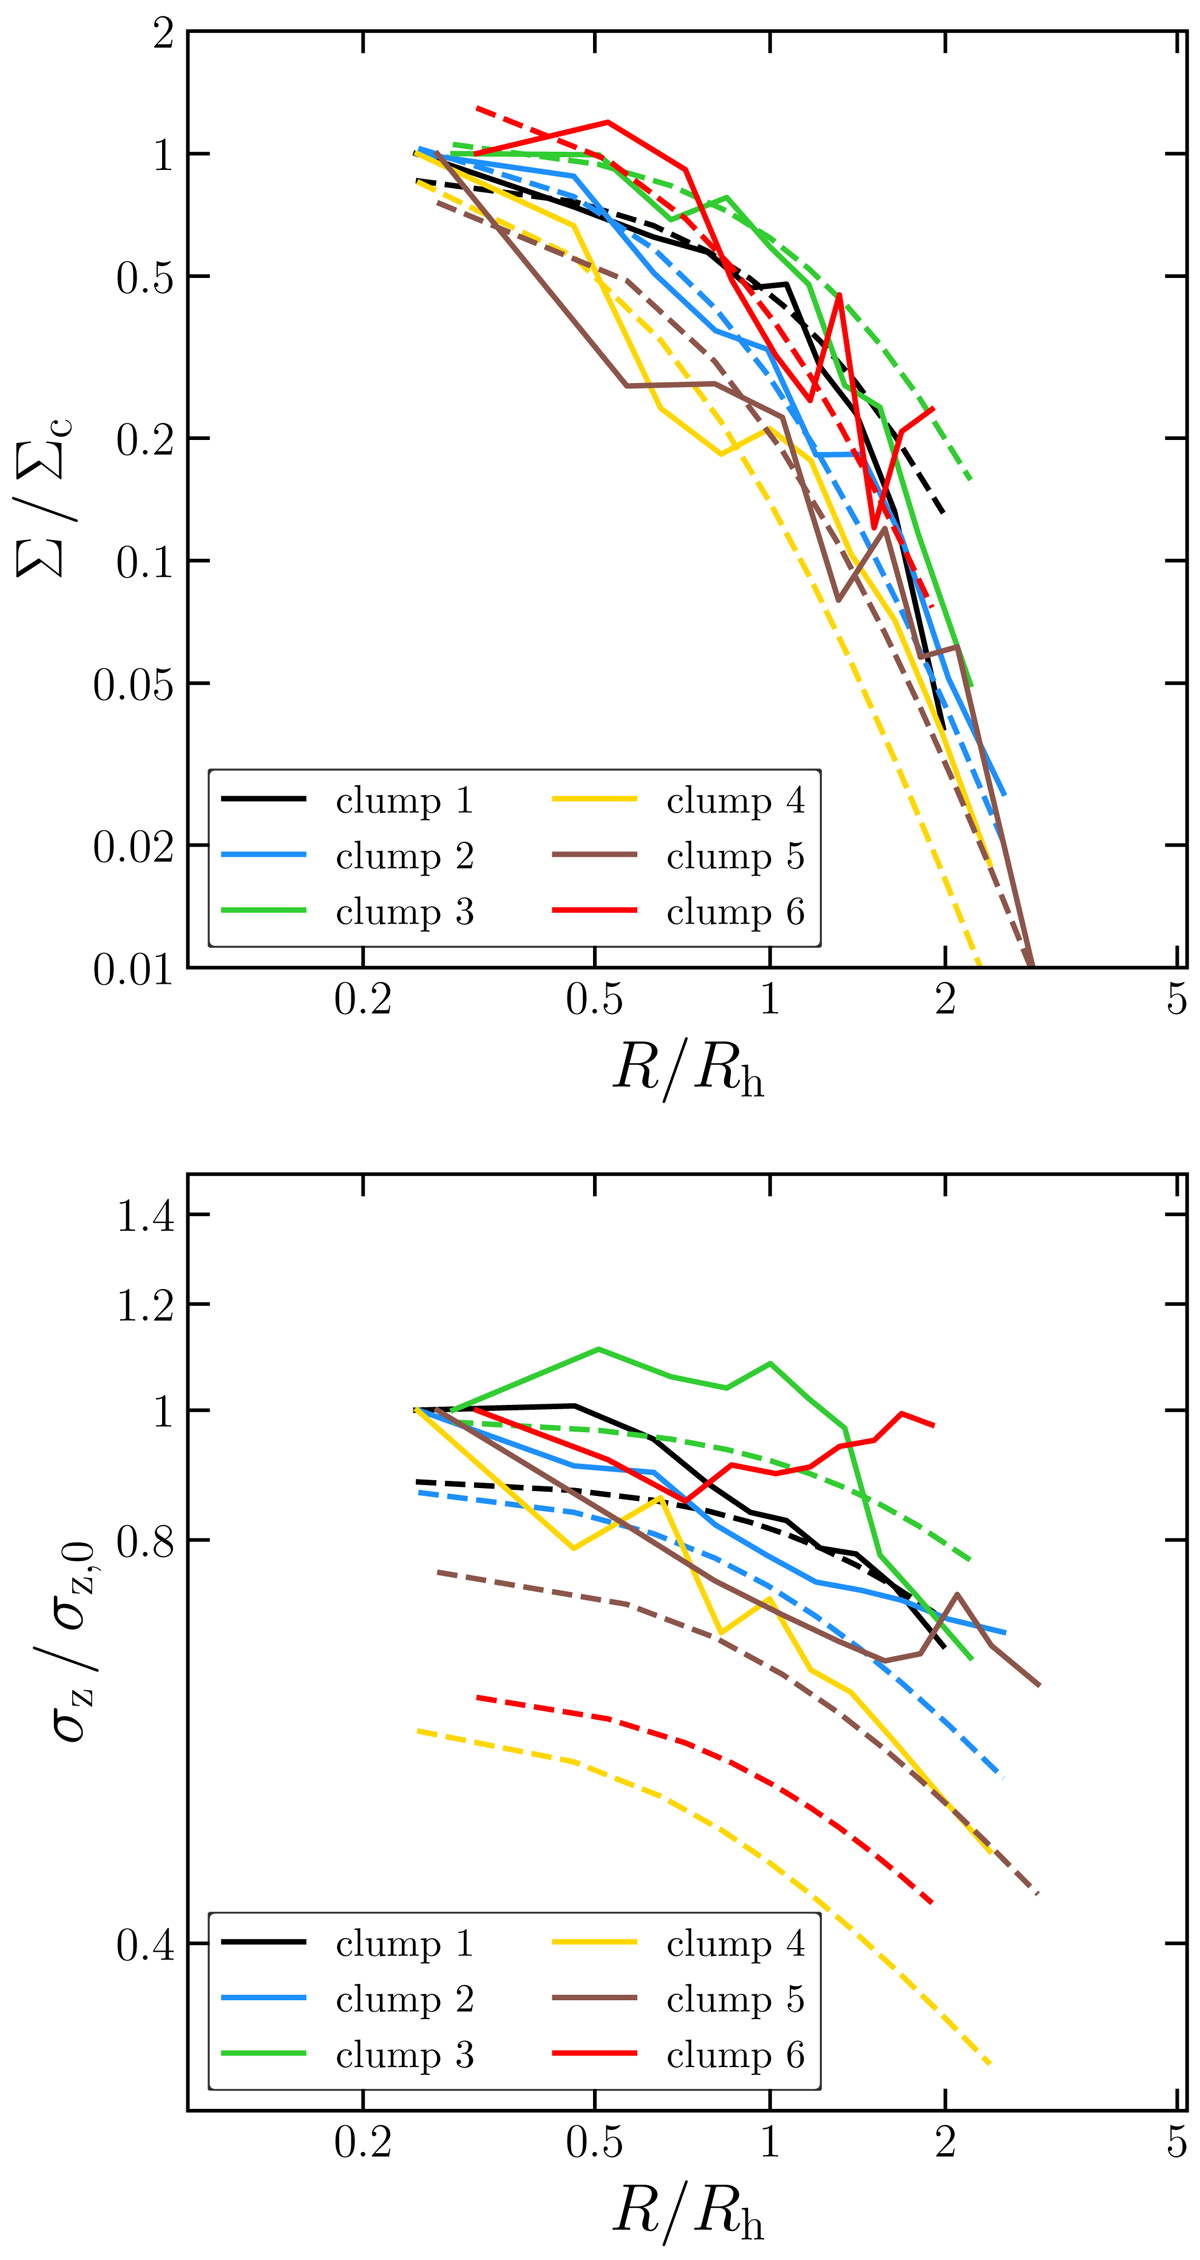
Fig. 23.
Download original image
Surface density profiles (top) and 1D velocity dispersion profiles (bottom) for the TFF09 snapshot. The best-fit Plummer model for each clump is also shown (dashed lines). The best-fit Plummer model is determined by fitting the surface density profile within one projected half-mass radius. The surface density and 1D velocity dispersion are both normalized to the corresponding values in the innermost radial bin of each clump.
Current usage metrics show cumulative count of Article Views (full-text article views including HTML views, PDF and ePub downloads, according to the available data) and Abstracts Views on Vision4Press platform.
Data correspond to usage on the plateform after 2015. The current usage metrics is available 48-96 hours after online publication and is updated daily on week days.
Initial download of the metrics may take a while.