Fig. 19.
Download original image
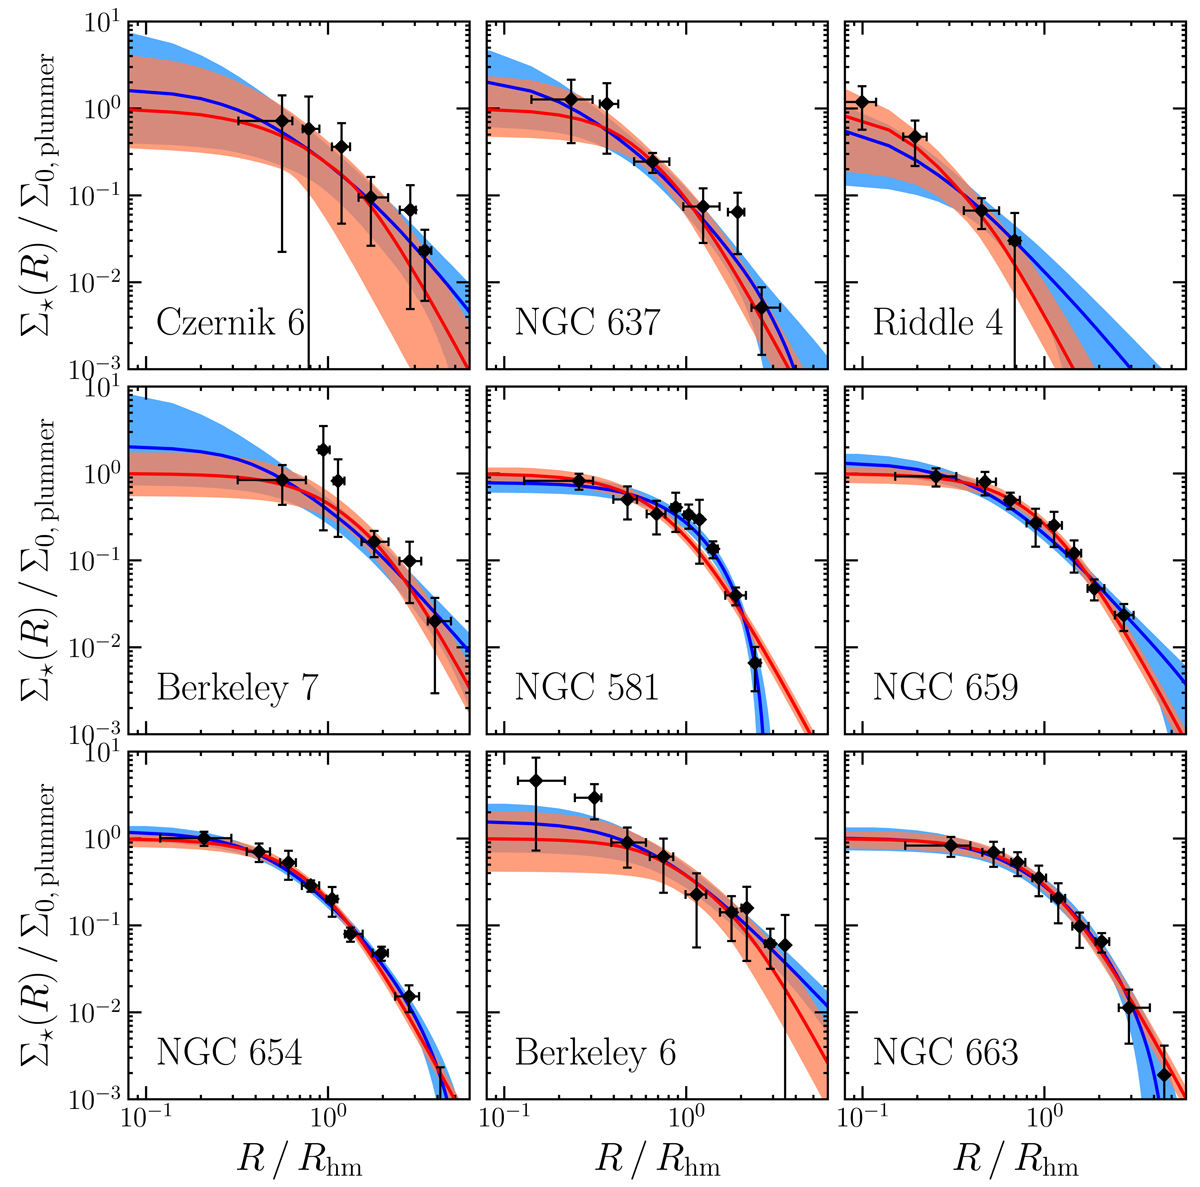
Number density profiles (black symbols) for the nine star clusters. Also shown are the model predictions for the Plummer (red) and King (blue) models. Shaded areas represent the 68% credible regions. All the profiles, both observed and models, were scaled to the central density predicted by the Plummer model Σ0, plummer and to the observed projected half-mass radius Rhm.
Current usage metrics show cumulative count of Article Views (full-text article views including HTML views, PDF and ePub downloads, according to the available data) and Abstracts Views on Vision4Press platform.
Data correspond to usage on the plateform after 2015. The current usage metrics is available 48-96 hours after online publication and is updated daily on week days.
Initial download of the metrics may take a while.