Open Access
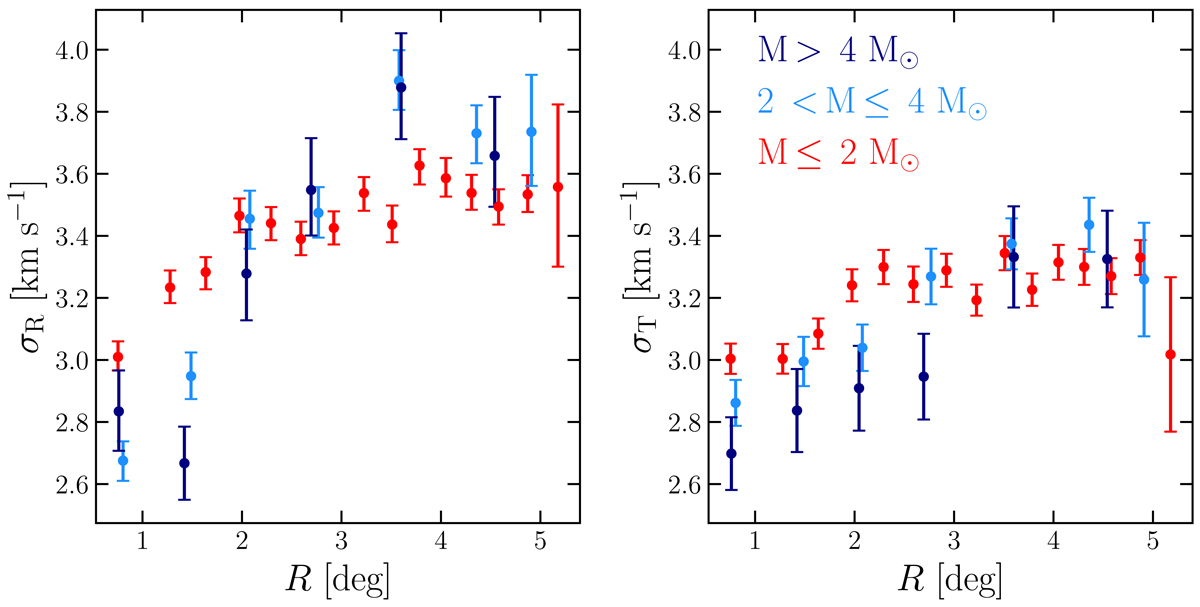
Fig. 16.
Download original image
Velocity dispersion profiles in the radial (left panel) and tangential (right panel) components, in three different mass bins depicted with different colors: red for the least massive bin and dark blue for the most massive.
Current usage metrics show cumulative count of Article Views (full-text article views including HTML views, PDF and ePub downloads, according to the available data) and Abstracts Views on Vision4Press platform.
Data correspond to usage on the plateform after 2015. The current usage metrics is available 48-96 hours after online publication and is updated daily on week days.
Initial download of the metrics may take a while.