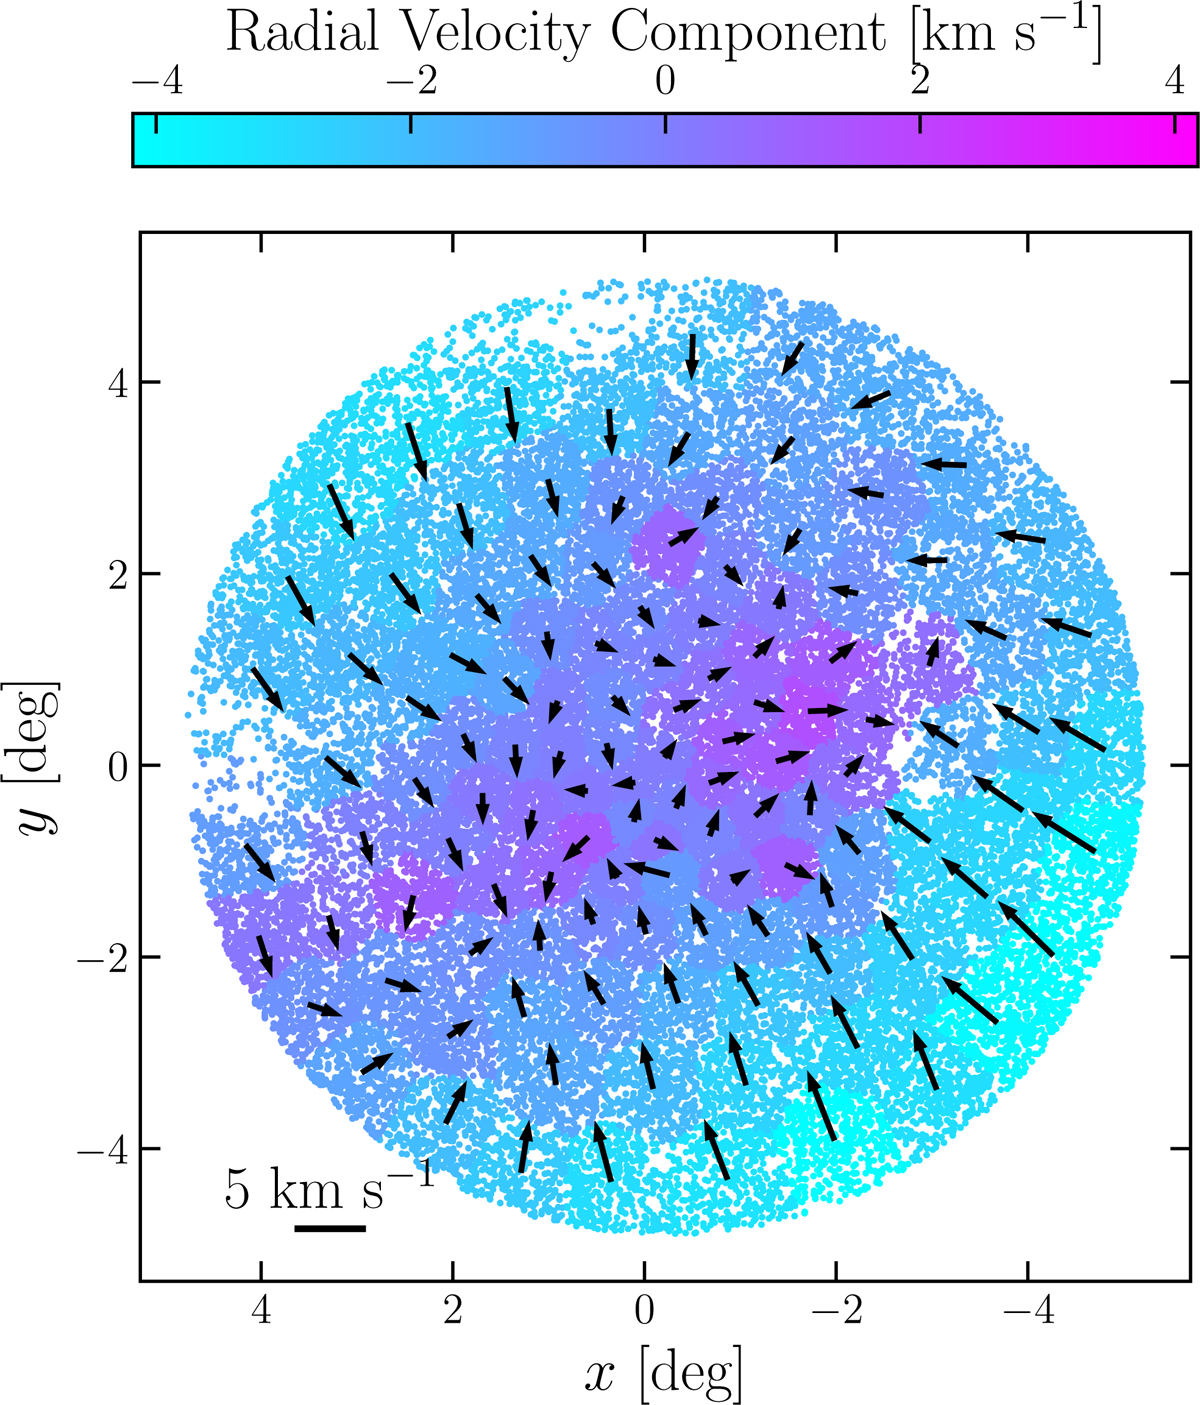
Fig. 12.
Download original image
Two-dimensional distribution of stars in local Cartesian coordinates (x; y). Stars are color-coded according to the inferred mean radial component of the velocity in their Voronoi bin, while black arrows show the mean velocity vector in each bin. Radial velocity is defined as positive if pointing away from the center, thus ![]() means expansion and
means expansion and ![]() means contraction. The velocity scale is shown in the bottom left corner.
means contraction. The velocity scale is shown in the bottom left corner.
Current usage metrics show cumulative count of Article Views (full-text article views including HTML views, PDF and ePub downloads, according to the available data) and Abstracts Views on Vision4Press platform.
Data correspond to usage on the plateform after 2015. The current usage metrics is available 48-96 hours after online publication and is updated daily on week days.
Initial download of the metrics may take a while.