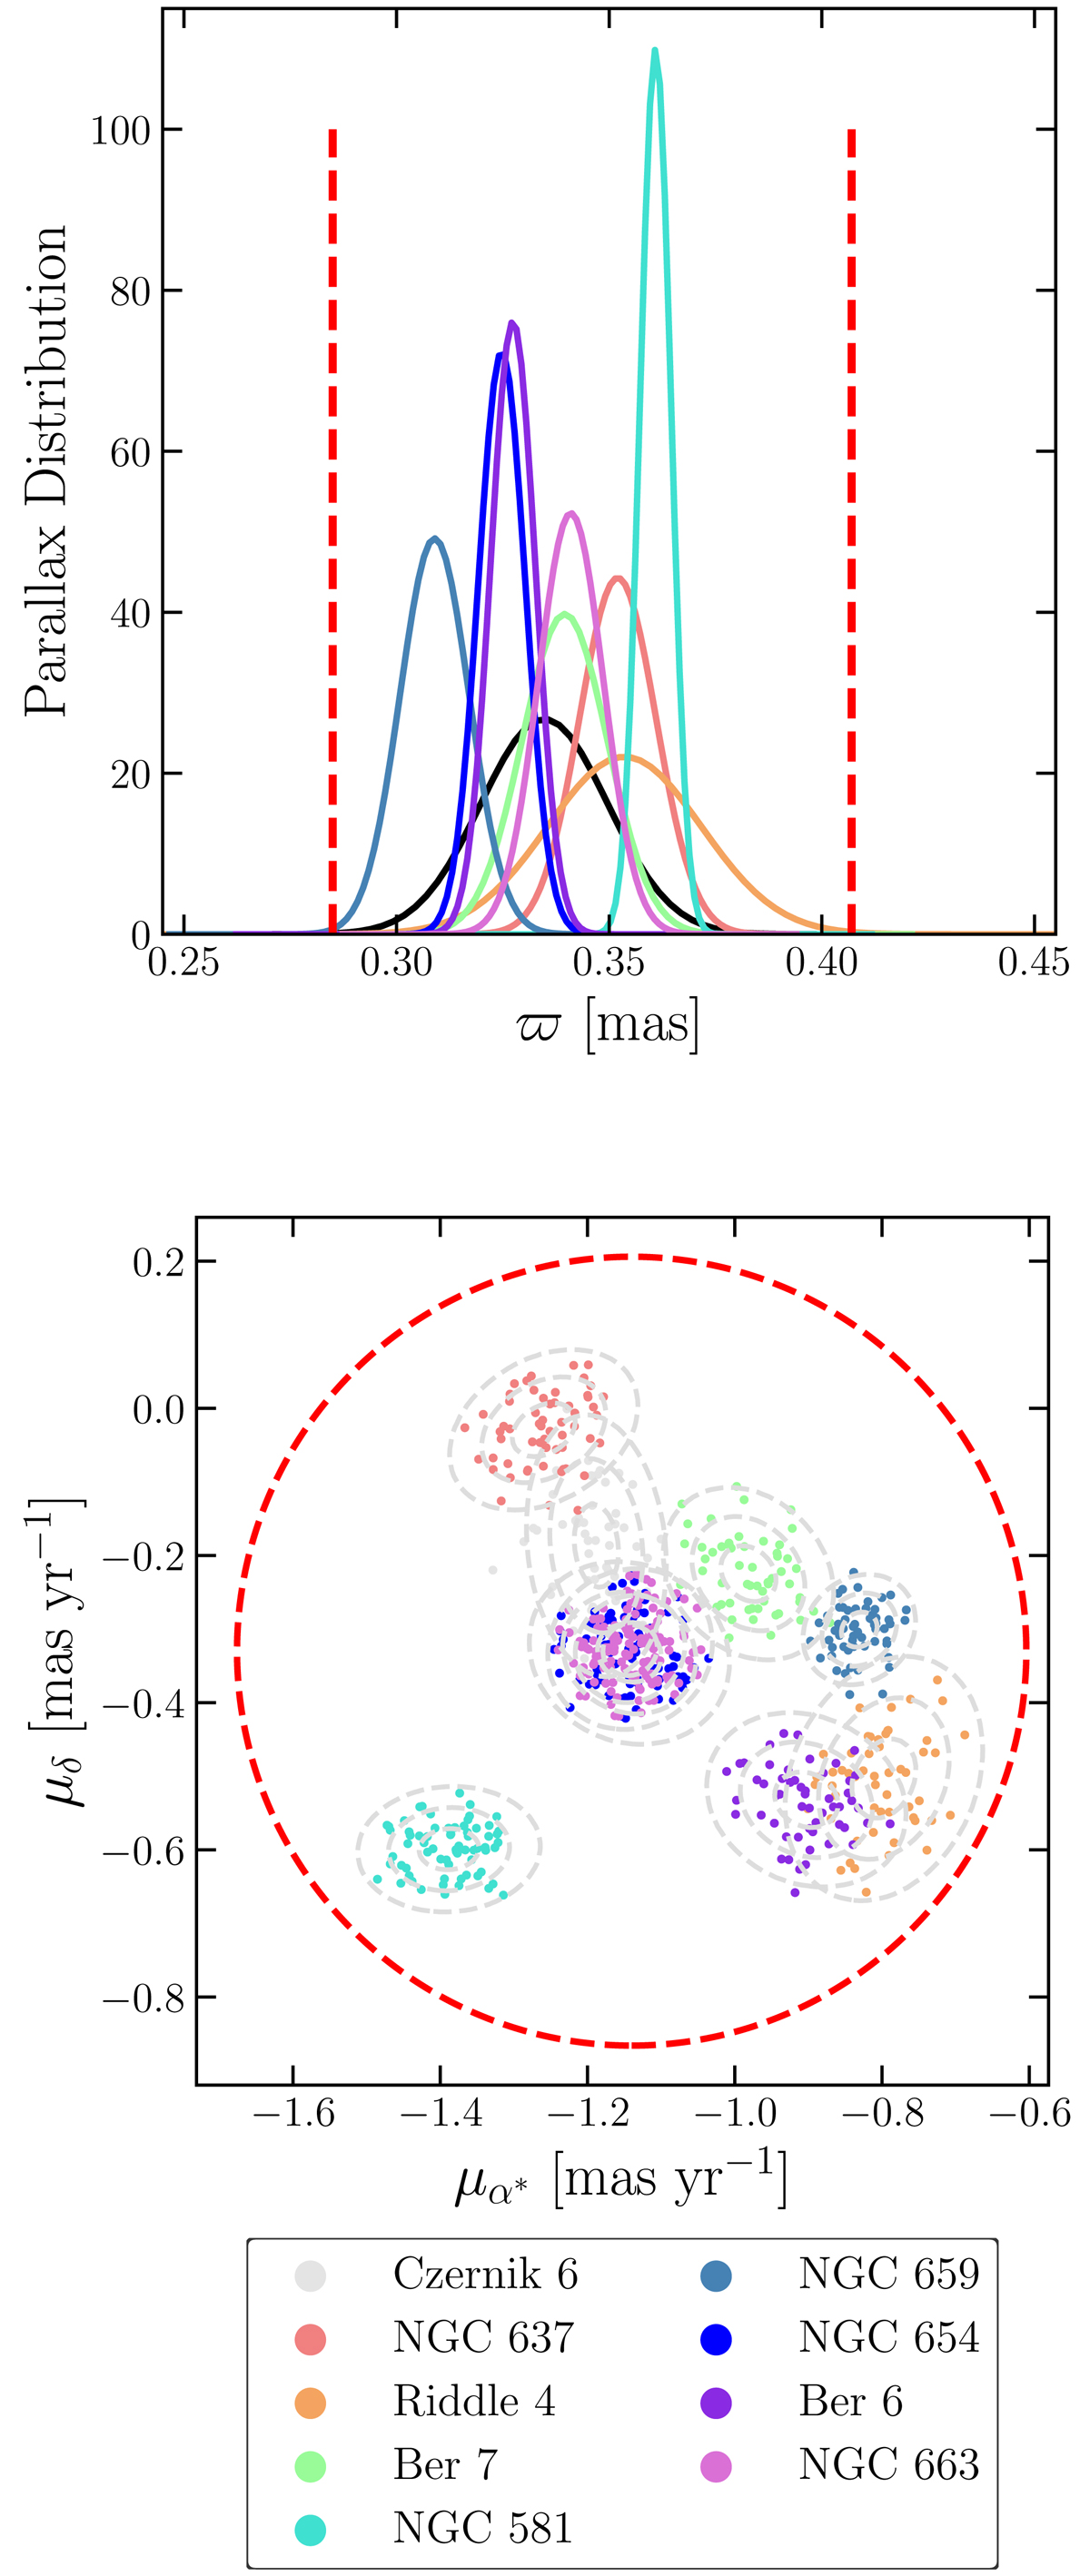
Fig. 1.
Download original image
Inferred distributions in parallax (top panel) and proper motion (bottom panel) from likely (> 90%) cluster members. Different stellar clusters are in different colors. Dashed gray lines in the bottom panel are iso-probability contours at the 1, 2, and 3σ levels. The red dashed circle and vertical lines represent the range in proper motion and parallax inside which stars were selected.
Current usage metrics show cumulative count of Article Views (full-text article views including HTML views, PDF and ePub downloads, according to the available data) and Abstracts Views on Vision4Press platform.
Data correspond to usage on the plateform after 2015. The current usage metrics is available 48-96 hours after online publication and is updated daily on week days.
Initial download of the metrics may take a while.