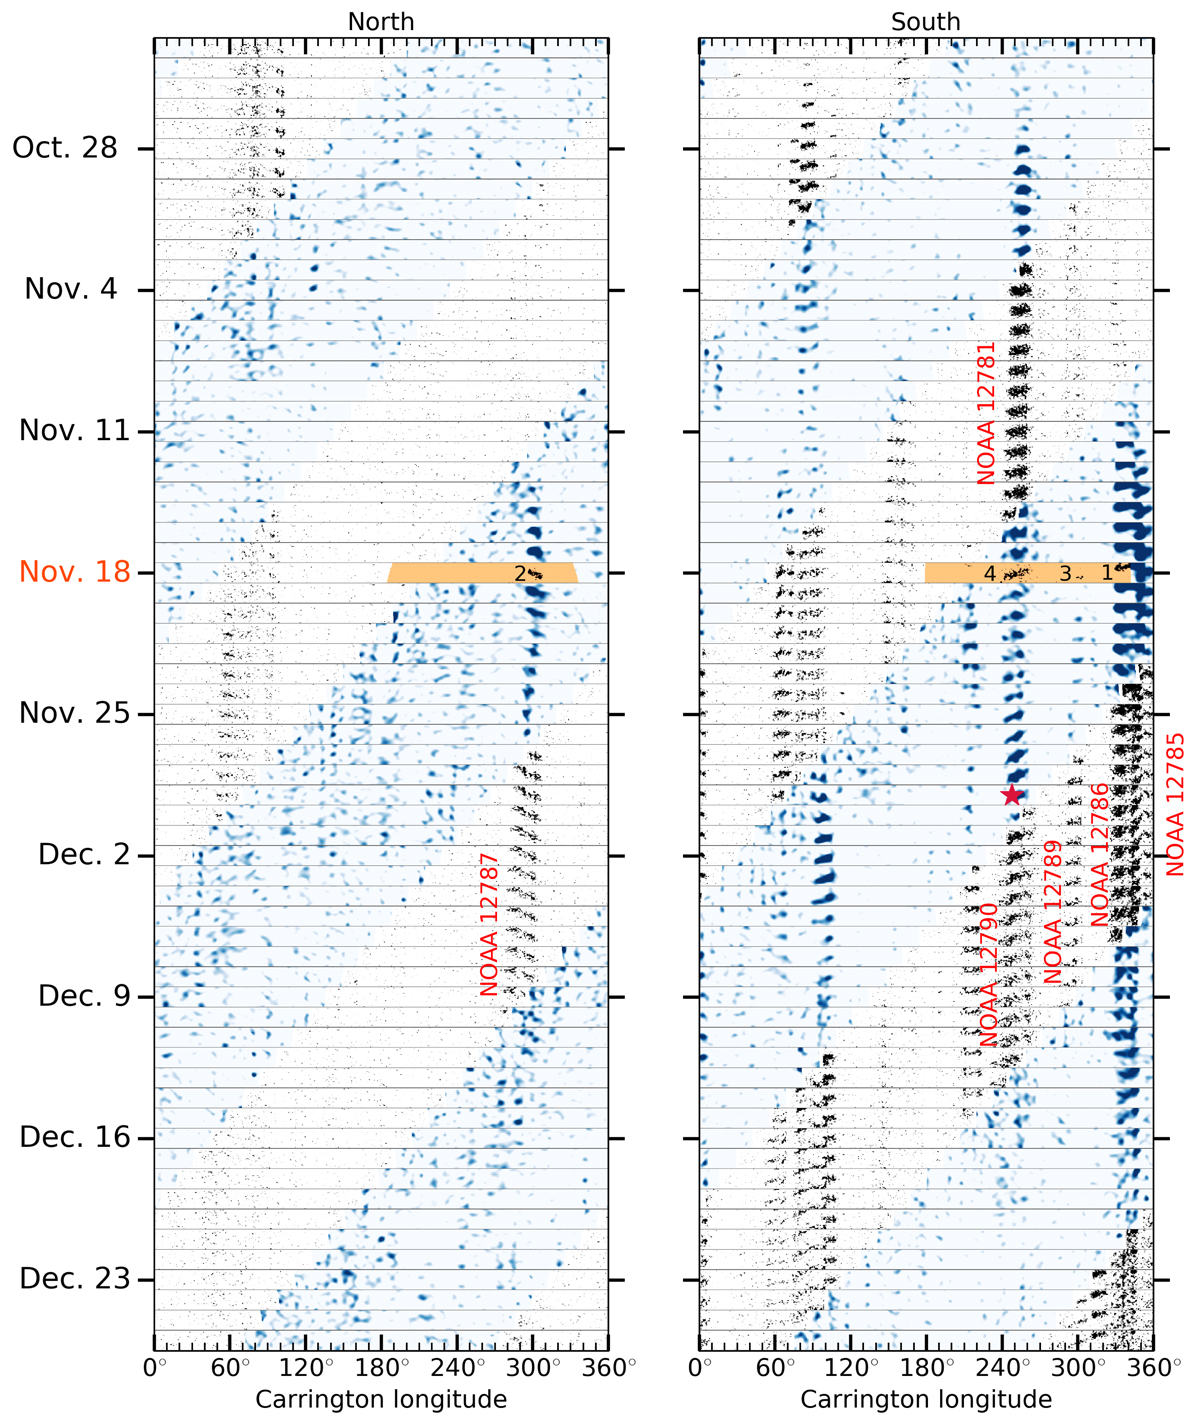
Fig. A.4.

Download original image
Average of the data from the right panel of Fig. 5 over the latitudinal band −30° ≤λ ≤ −15° in the South. The averages of BΦ are given by the blue curves (far side), the averages of |Blos| by the black curves (near side), and the average of |Blos| from SO/PHI for 18 November 2020 by the orange curve. The magnetic field data are further smoothed in longitude with a running mean over 4°. The filled areas below the curves highlight the values above 20 G. The red star indicates the same flare (M 4.4), as shown in Fig. 5.
Current usage metrics show cumulative count of Article Views (full-text article views including HTML views, PDF and ePub downloads, according to the available data) and Abstracts Views on Vision4Press platform.
Data correspond to usage on the plateform after 2015. The current usage metrics is available 48-96 hours after online publication and is updated daily on week days.
Initial download of the metrics may take a while.


