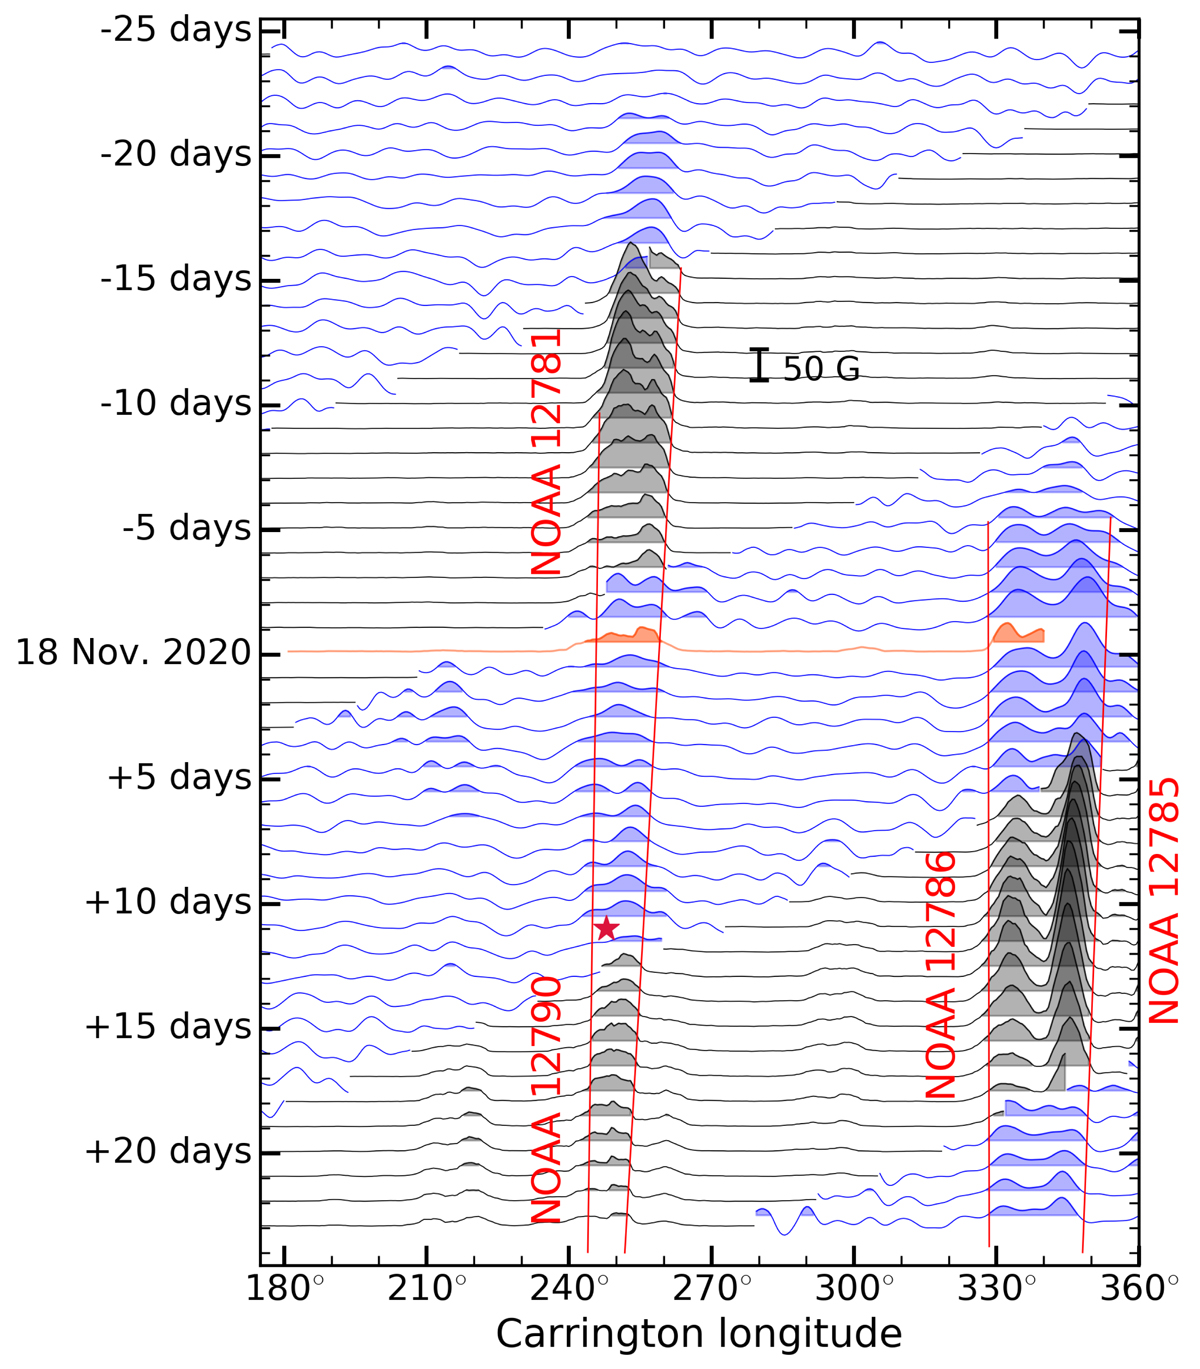
Fig. A.3.

Download original image
Plots of BΦ from far-side helioseismology for 17–19 November 2020 (blue) and unsigned line-of-sight magnetic field |Blos| on 18 November 2020 from SO/PHI (orange) and SDO/HMI (yellow). The data are averaged over the latitude band 25° ≤λ ≤ 40° in the north (a) and over the latitude band −30° ≤λ ≤ −15° in the south (b). Note: |Blos| is smoothed in longitude with a running mean over 4°. The active regions 1, 2, and 4 are indicated on the plots (see Table 1). Notice that the values shown here for active regions 1, 2, and 4 are not directly comparable to the values given in Fig. 4 because we are averaging over latitude bands and not over active region areas.
Current usage metrics show cumulative count of Article Views (full-text article views including HTML views, PDF and ePub downloads, according to the available data) and Abstracts Views on Vision4Press platform.
Data correspond to usage on the plateform after 2015. The current usage metrics is available 48-96 hours after online publication and is updated daily on week days.
Initial download of the metrics may take a while.


