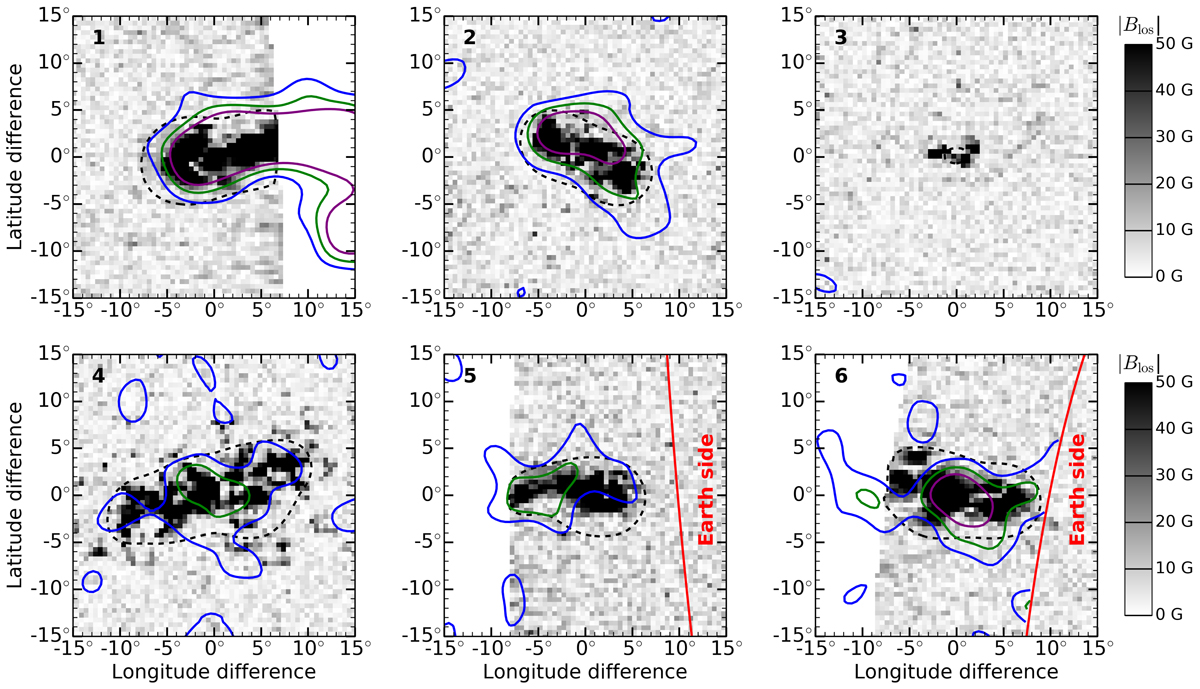
Fig. A.1.

Download original image
Same as Fig. 2, but for the other two active regions identified with SO/PHI on the far side (red contours): Active region 5 on 3 October 2021 (left panels) and active region 6 (right panels) on 3 February 2022. Both regions appear on the near side about one day later. The higher seismic noise in the right panels is due to lower-quality SDO/HMI data (see main text).
Current usage metrics show cumulative count of Article Views (full-text article views including HTML views, PDF and ePub downloads, according to the available data) and Abstracts Views on Vision4Press platform.
Data correspond to usage on the plateform after 2015. The current usage metrics is available 48-96 hours after online publication and is updated daily on week days.
Initial download of the metrics may take a while.


