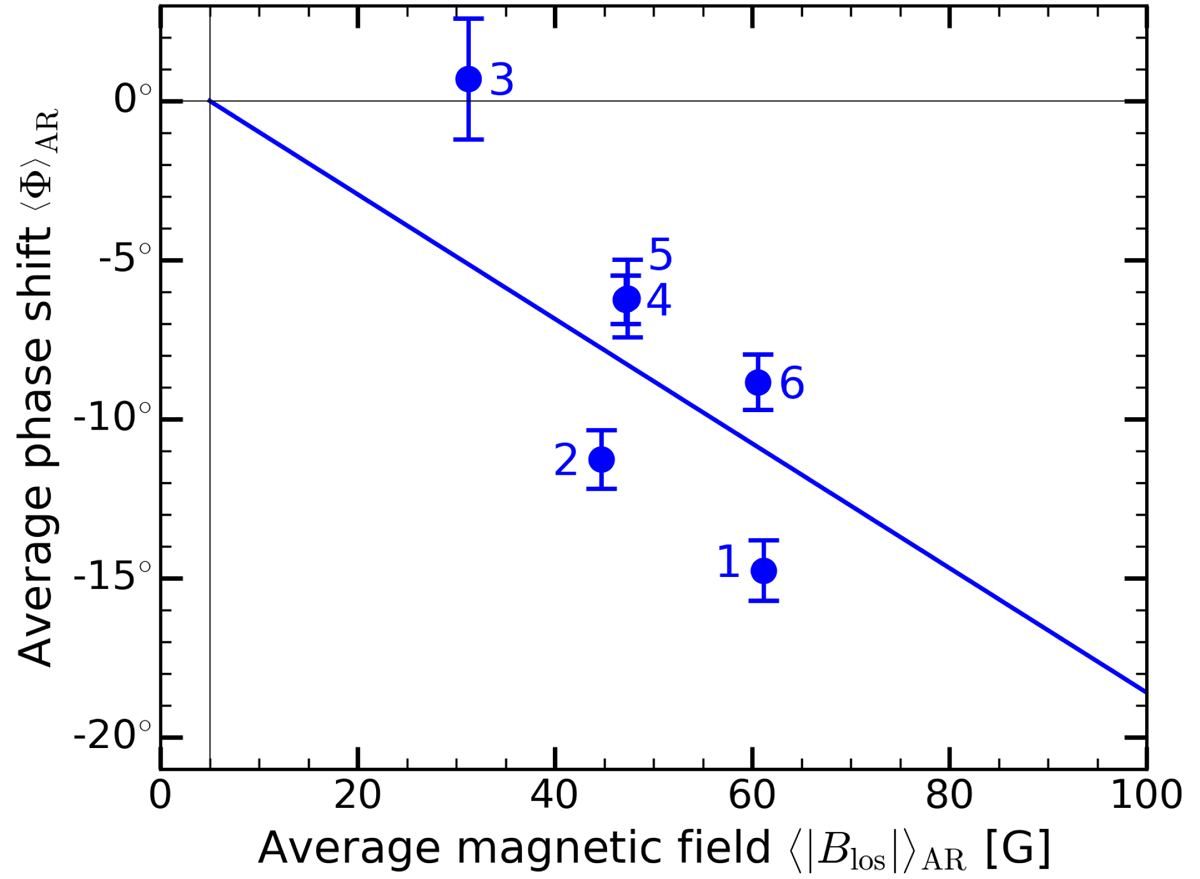
Fig. 4.

Download original image
Helioseismic phase shift Φ versus unsigned line-of-sight magnetic field |Blos|, both averaged over each of the six active regions on the far side (blue dots). Active region areas are determined from SO/PHI magnetograms (red contours in Figs. 2 and A.1). The numerical values are provided in Table 1 and the error bars refer to ±1σΦ seismic noise. The blue solid line is a linear fit with slope −0.2 deg G−1 and intercept (5 G, 0°).
Current usage metrics show cumulative count of Article Views (full-text article views including HTML views, PDF and ePub downloads, according to the available data) and Abstracts Views on Vision4Press platform.
Data correspond to usage on the plateform after 2015. The current usage metrics is available 48-96 hours after online publication and is updated daily on week days.
Initial download of the metrics may take a while.


