Fig. 3.

Download original image
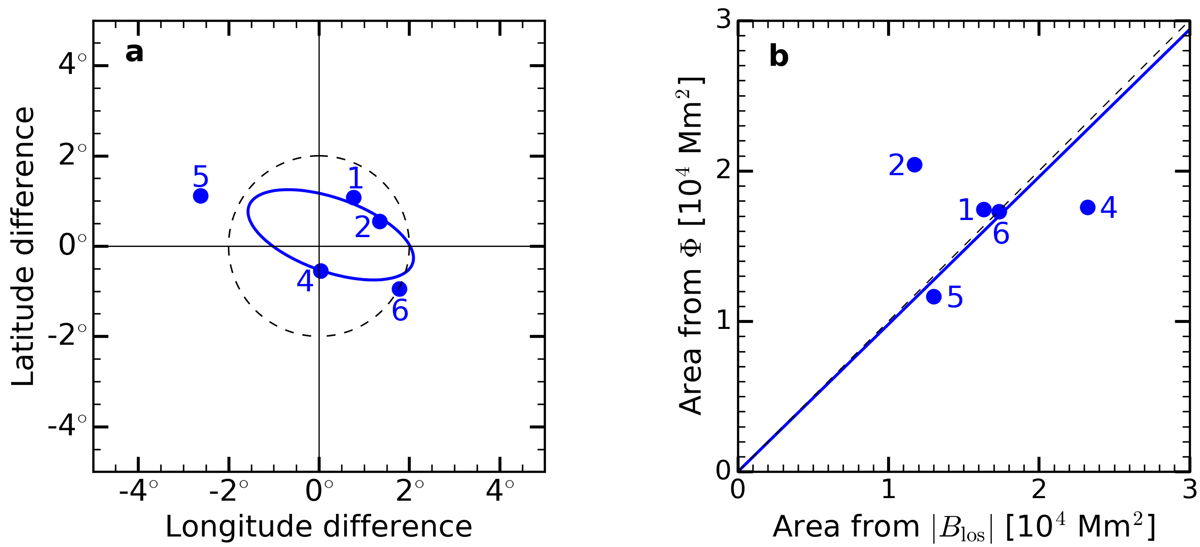
Positions of active regions 1, 2, 4, 5, and 6 deduced from the seismic maps, with respect to their actual positions deduced from the SO/PHI magnetograms (a). The active region coordinates are computed using a center-of-gravity method, applied to each observable (Φ or Blos) within the region areas. For the SO/PHI magnetograms, the active region areas correspond to the red contours in Figs. 2 and A.1 (20 G contours from the smoothed magnetograms). For the helioseismic data, a threshold of 2σΦ is used to determine the active region areas. The blue ellipse shows the probability density function of the data points at half maximum, assuming a bivariate normal distribution. The dashed circle with a diameter 4° corresponds to the resolution limit of the seismic observations. Active region areas inferred from helioseismology versus areas measured from the SO/PHI magnetograms (b). The linear fit gives a slope of 0.98 (solid blue line). The dashed line is the 1:1 diagonal.
Current usage metrics show cumulative count of Article Views (full-text article views including HTML views, PDF and ePub downloads, according to the available data) and Abstracts Views on Vision4Press platform.
Data correspond to usage on the plateform after 2015. The current usage metrics is available 48-96 hours after online publication and is updated daily on week days.
Initial download of the metrics may take a while.


