Fig. 2.

Download original image
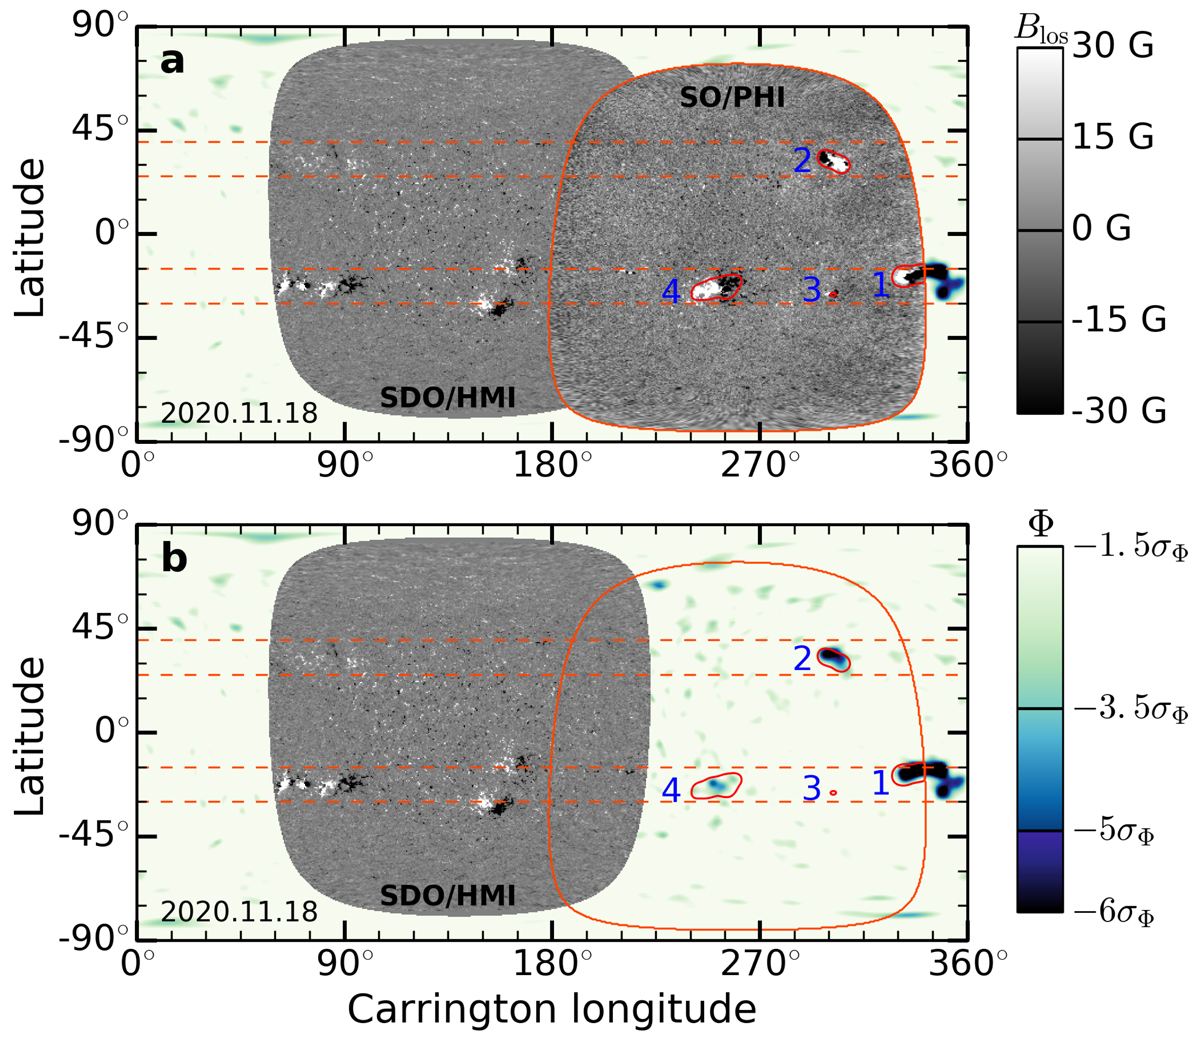
Magnetic activity on the entire solar surface on 18 November 2020 during Carrington Rotation CR 2237. Panel a: SO/PHI-FDT magnetogram covers a large fraction of the far side, while a 3-day averaged SDO/HMI magnetogram shows magnetic activity on the near side. Four active regions identified on the far side by SO/PHI are outlined by red contours (see Table 1). Panel b: green-blue shades show the helioseismic phase Φ on the far side, deduced from acoustic oscillations observed on the near-side by SDO/HMI over 79 h between 17–19 November. The seismic phase is shown over a range corresponding to 1.5 − 6 times the standard deviation of the noise in the quiet Sun (σΦ = 2.6°).
Current usage metrics show cumulative count of Article Views (full-text article views including HTML views, PDF and ePub downloads, according to the available data) and Abstracts Views on Vision4Press platform.
Data correspond to usage on the plateform after 2015. The current usage metrics is available 48-96 hours after online publication and is updated daily on week days.
Initial download of the metrics may take a while.


