Open Access
Fig. 19
Download original image
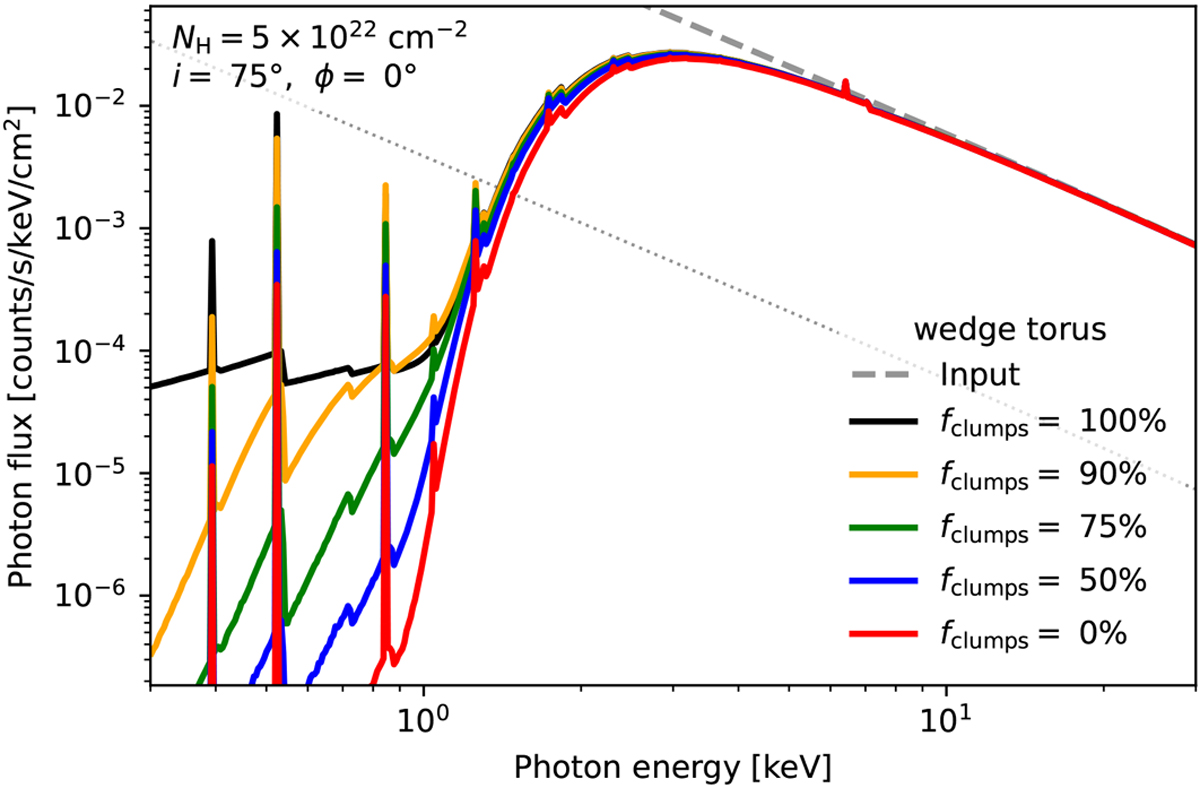
SKIRT X-ray spectra for torus models with different clump mass fractions fclumps The red, blue, and black spectra correspond to the smooth, two-phase, and clumpy tori in Fig. 18, respectively. The grey dotted line represents additional Thomson scattered emission at 1% of the intrinsic continuum (see Gupta et al. 2021).
Current usage metrics show cumulative count of Article Views (full-text article views including HTML views, PDF and ePub downloads, according to the available data) and Abstracts Views on Vision4Press platform.
Data correspond to usage on the plateform after 2015. The current usage metrics is available 48-96 hours after online publication and is updated daily on week days.
Initial download of the metrics may take a while.