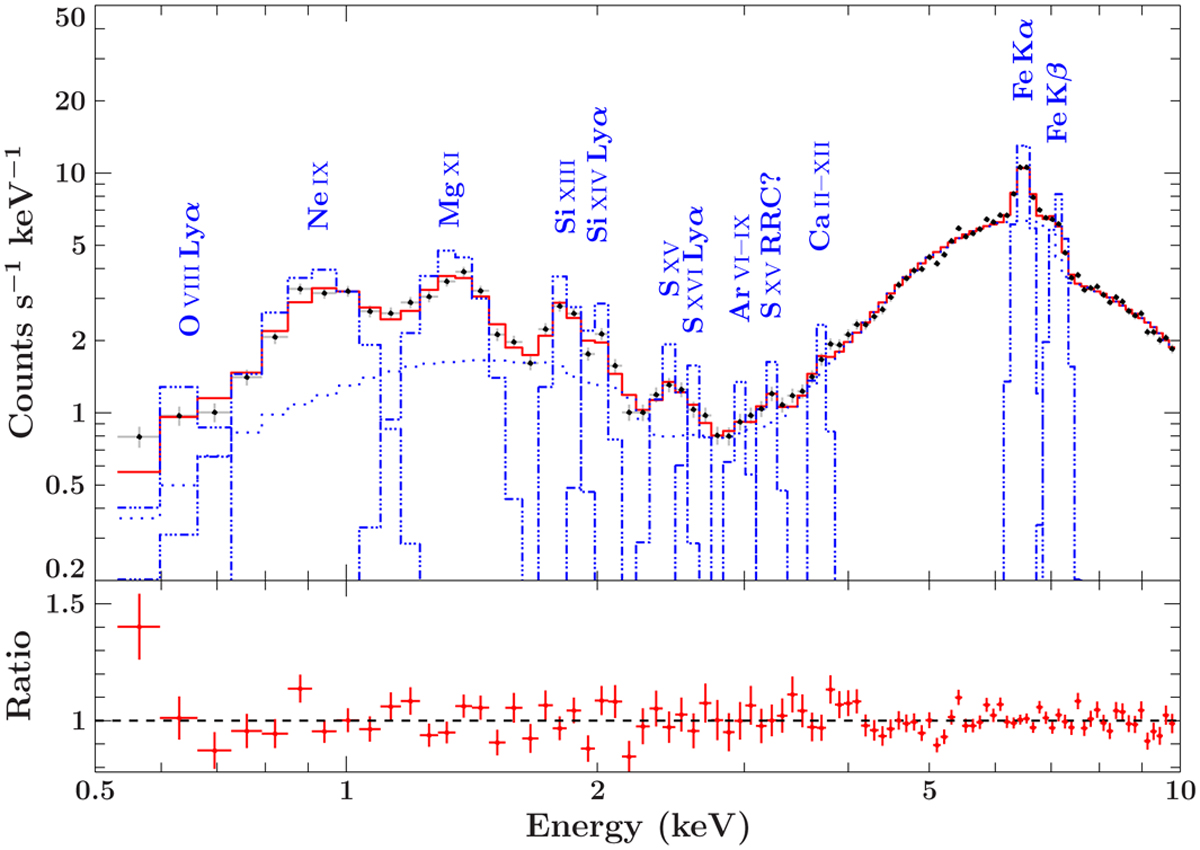
Fig. 7
Download original image
Example XMM-Newton EPIC-pn spectrum (black datapoints). We show the last and most absorbed NuSTAR-orbit of our observation. We indicate the individual model components including all lines detected in this dataset (blue dot-dashed Gaussians) and the absorbed continuum (blue dotted line). We refer to Sect. 4.2 for a detailed description of the model and to Table 2 for the soft lines.
Current usage metrics show cumulative count of Article Views (full-text article views including HTML views, PDF and ePub downloads, according to the available data) and Abstracts Views on Vision4Press platform.
Data correspond to usage on the plateform after 2015. The current usage metrics is available 48-96 hours after online publication and is updated daily on week days.
Initial download of the metrics may take a while.