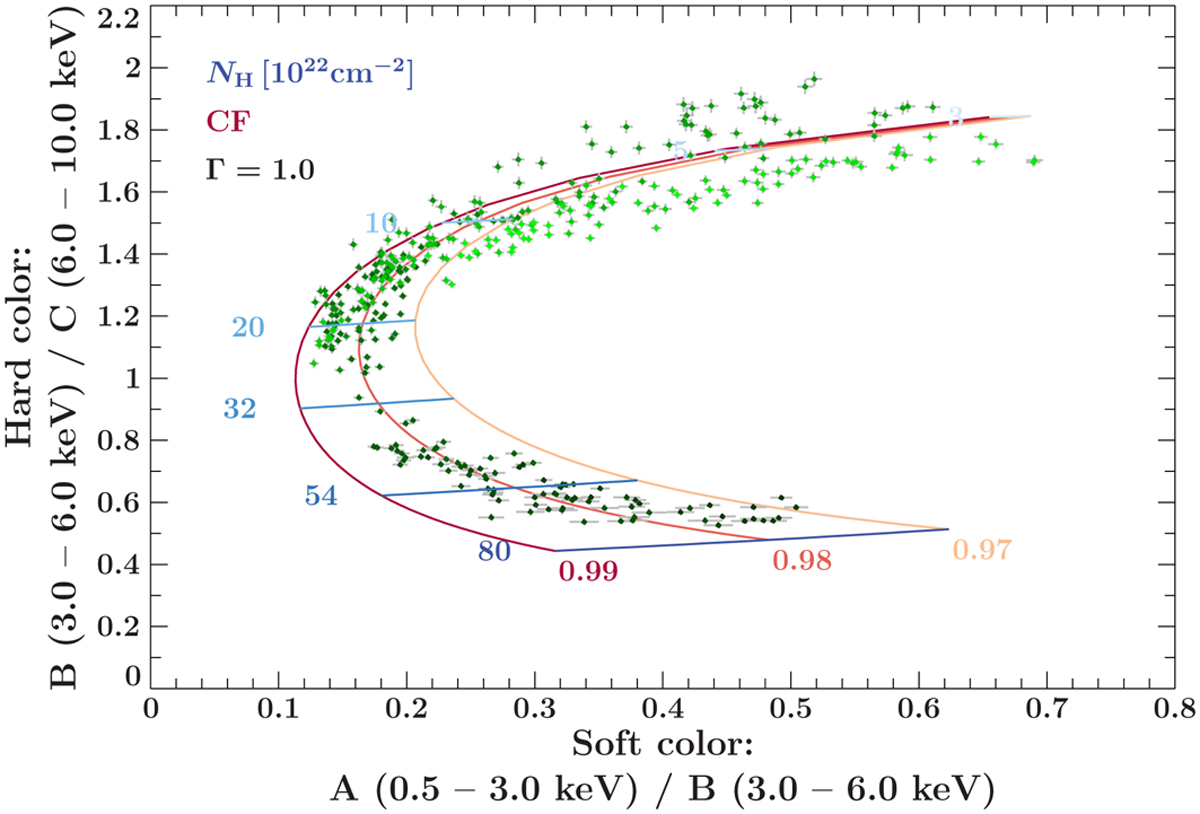
Fig. 6
Download original image
XMM-Newton EPIC-pn colour-colour diagram. The data points represent the ratios of the light curves in hard colour depending on soft colour, from beginning (light green) to end (dark green) of the observation. We also show the theoretical expectation for different covering fractions CF (shades of red, varying from 0.97 to 0.99) and absorption column densities NH,1 (shades of blue, varying from 3 × 1022 cm−2 to 80 × 1022 cm−2) using our partial covering model from Eq. (4). We used a photon index Γ of 1.0. More details about the simulation and its interpretation are given in Sect. 5.1.1.
Current usage metrics show cumulative count of Article Views (full-text article views including HTML views, PDF and ePub downloads, according to the available data) and Abstracts Views on Vision4Press platform.
Data correspond to usage on the plateform after 2015. The current usage metrics is available 48-96 hours after online publication and is updated daily on week days.
Initial download of the metrics may take a while.