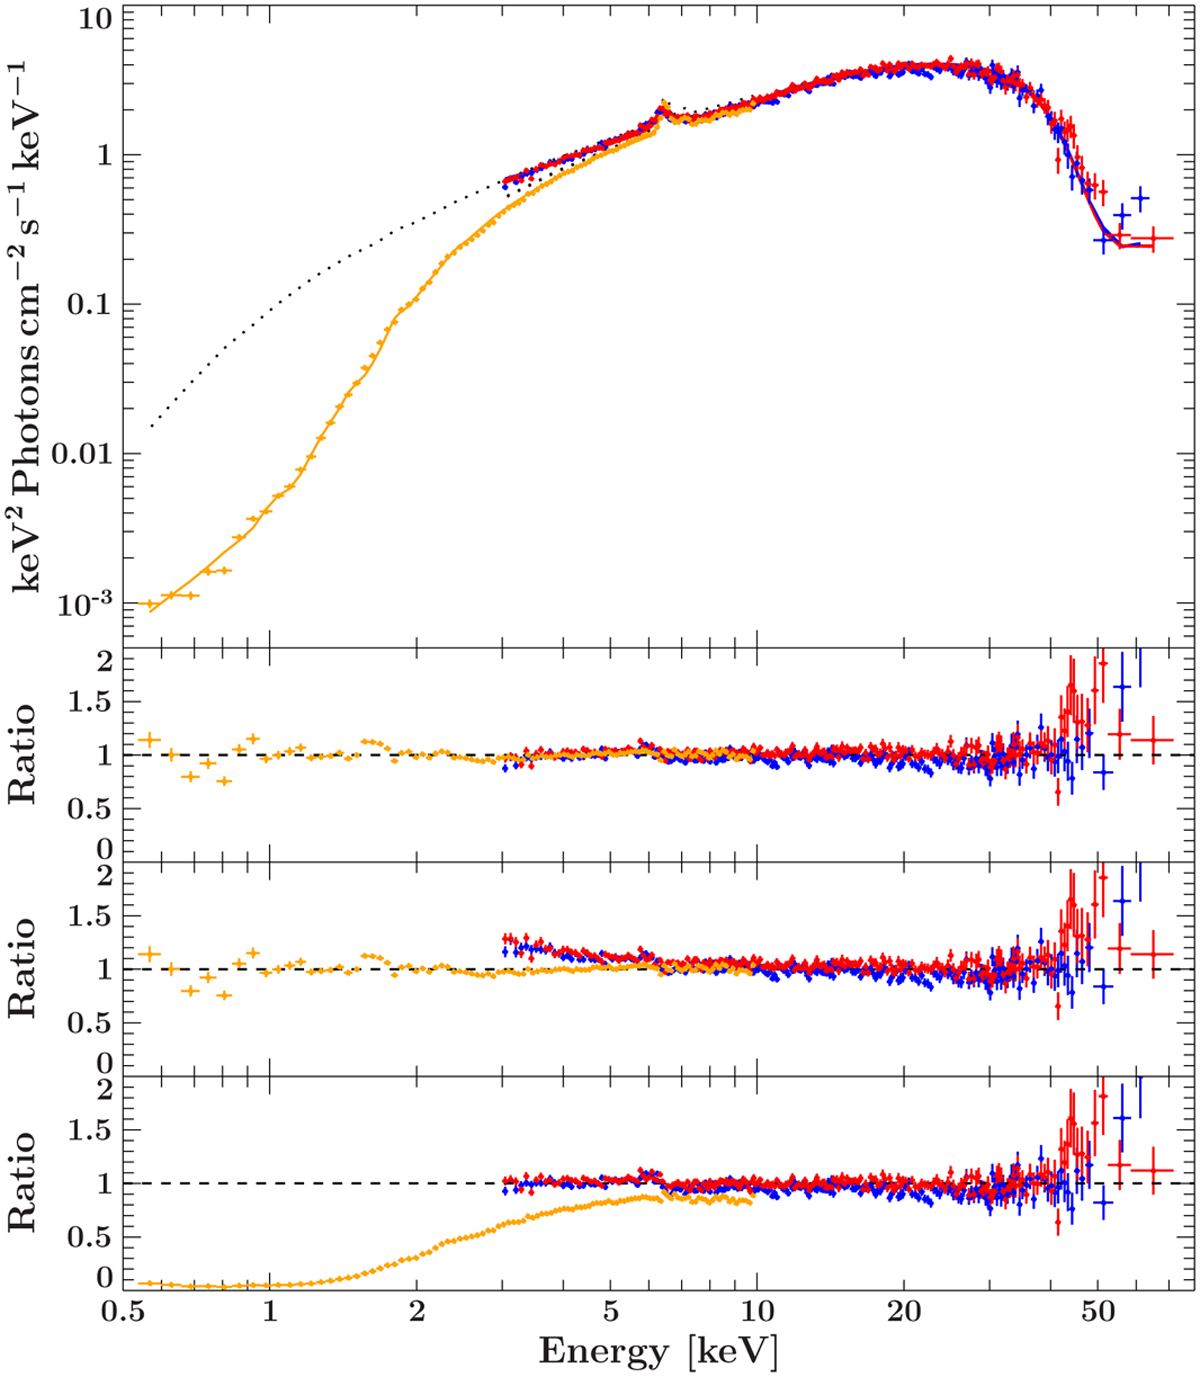
Fig. A.4
Download original image
Example of an unfolded spectrum taken with XMM-Newton EPIC-pn (orange), NuSTAR FPMA (red), and FPMB (blue) during the fourth NuSTAR orbit. Solid lines show the best-fit model with independent CFXMN and CFNuSTAR, and dotted lines account for best-fit model with tied CFs. First residual panel: Best-fit model with independent covering fractions. Second residual panel: Best-fit model with CFNuSTAR tied to CFXMN- Last residual panel: Best-fit model with CFXMN tied to CFNuSTAR- A strong soft excess in the NuSTAR data is visible at ~3 keV in comparison to the XMM-Newton data.
Current usage metrics show cumulative count of Article Views (full-text article views including HTML views, PDF and ePub downloads, according to the available data) and Abstracts Views on Vision4Press platform.
Data correspond to usage on the plateform after 2015. The current usage metrics is available 48-96 hours after online publication and is updated daily on week days.
Initial download of the metrics may take a while.