Fig. 10
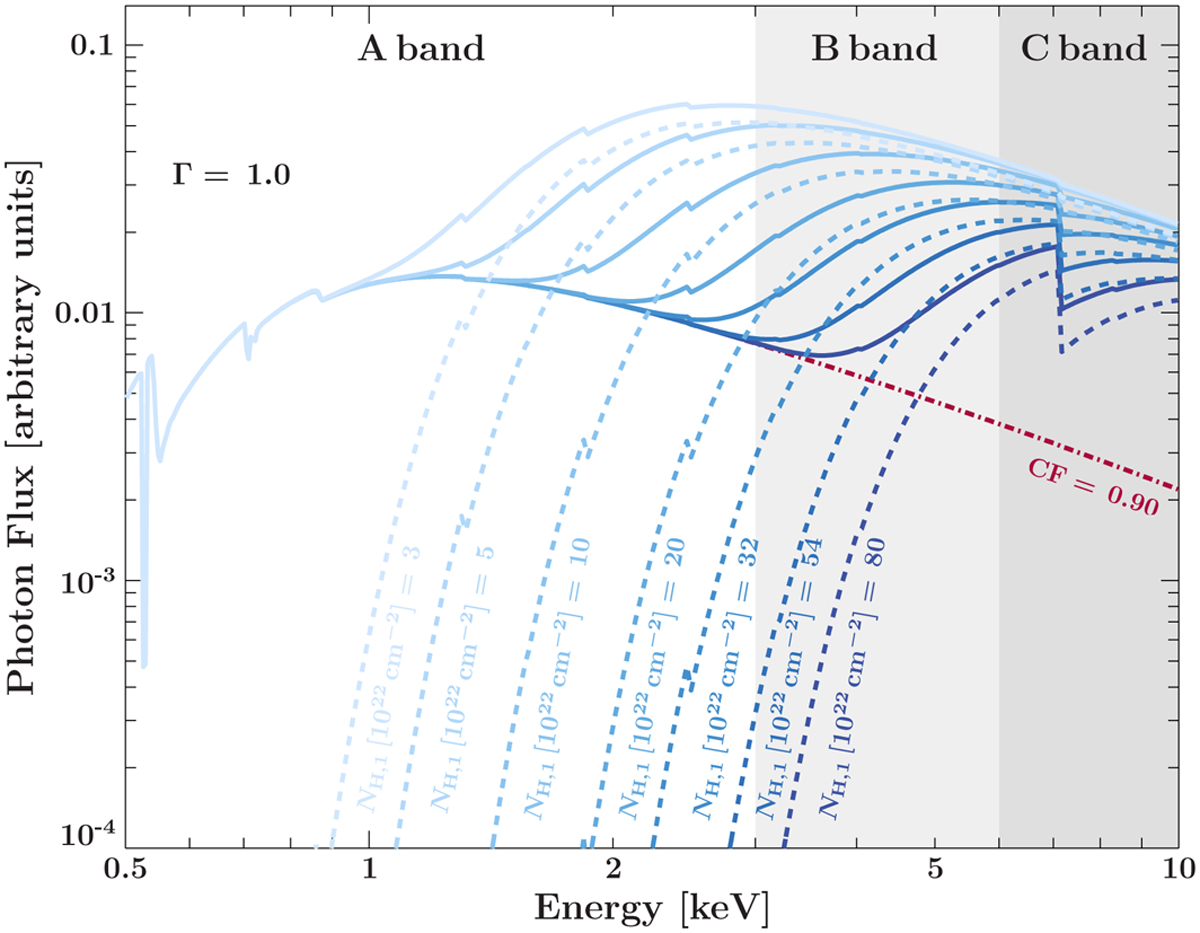
Download original image
Effect of increasing absorption on our model from Eq. (4) with photon index Γ = 1.0 and without emission lines to focus on the evolution of the continuum shape. We assume a CF of 0.9 and a varying absorption column density NH,1 from 3 × 1022 cm−2 to 80 × 1022 cm−2 covering the range obtained in Fig. 9. The shaded grey areas indicate three energy bands of interest: The A band from 0.5 to 3 keV, B band from 3 to 6 keV, and C band from 6 to 10 keV. The resulting observed spectrum (solid lines) is the sum of the spectrum not covered by the stellar wind (dash-dotted line) and the covered spectrum (dashed lines). See Fig. 3 of Diez et al. (2022) for an illustrated picture of the partial covering model.
Current usage metrics show cumulative count of Article Views (full-text article views including HTML views, PDF and ePub downloads, according to the available data) and Abstracts Views on Vision4Press platform.
Data correspond to usage on the plateform after 2015. The current usage metrics is available 48-96 hours after online publication and is updated daily on week days.
Initial download of the metrics may take a while.