Fig. 5
Download original image
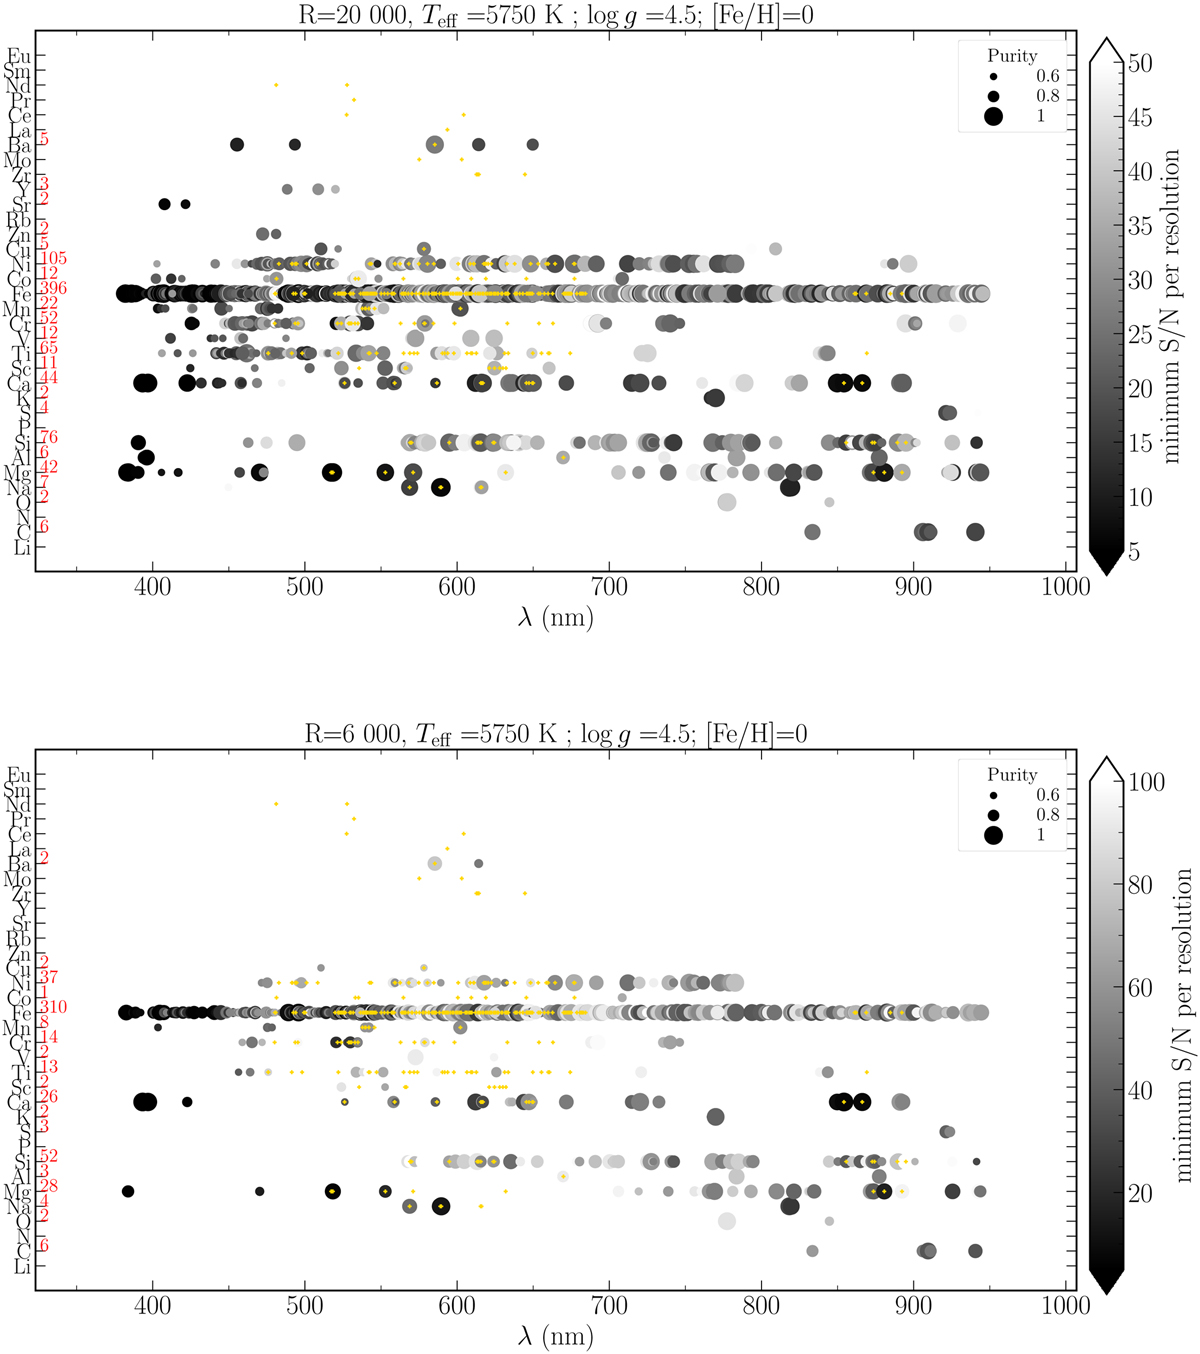
Lines detected for a HR (R = 20 000, top) and a LR (R = 6000, bottom) set-up, for a Solar-like star. The names of the elements are indicated on the left-hand side of the plots. The number of identified lines is written in red, next to each element. The points are located at the wavelength where a line is detected. The area of the circles is proportional to the purity of the line, and their colour to the minimum S/Nresol required to detect the line. A simple way to read this plot is the following: if a point is difficult to visualise (small in size and white), then the spectral line is difficult to detect and use. The minimum purity plotted is 0.6. Similarly, lines that require a S/Nresol > 50 in HR or S/Nresol > 100 in LR are excluded. Indicatively, yellow ’+’ symbols are located to the wavelengths at which the Gaia-ESO survey has identified, for R = 40 000, lines that are reliable and pure for spectral synthesis (synflag=‘Y’, see Heiter et al. 2021, and Sect. 4.1).
Current usage metrics show cumulative count of Article Views (full-text article views including HTML views, PDF and ePub downloads, according to the available data) and Abstracts Views on Vision4Press platform.
Data correspond to usage on the plateform after 2015. The current usage metrics is available 48-96 hours after online publication and is updated daily on week days.
Initial download of the metrics may take a while.