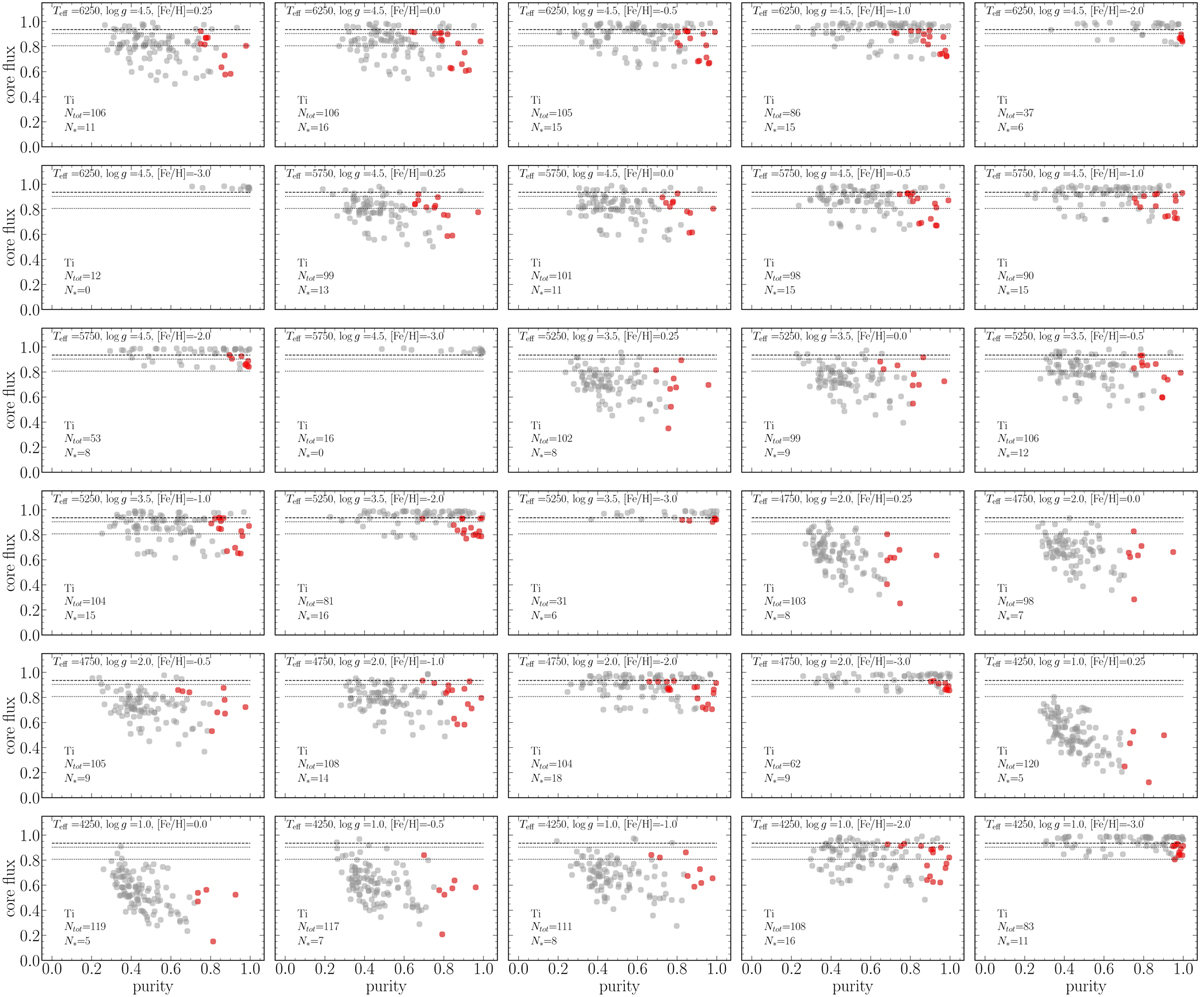
Fig. 10

Download original image
Flux at the core of the lines versus purity of the lines for a given element (Ti) and different stellar types (parameters written at the top of each panel). The total available lines, from VALD, are in grey and the selected golden-subsample is in red. The dashed line is located at our S/Nresoļ threshold of 70, i.e. the lines need to be deeper than this in order to be detected. The other two dotted lines split the S/N range from 0 to 70 into three, within which we can select at least five lines, provided they have a purity greater than 0.6.
Current usage metrics show cumulative count of Article Views (full-text article views including HTML views, PDF and ePub downloads, according to the available data) and Abstracts Views on Vision4Press platform.
Data correspond to usage on the plateform after 2015. The current usage metrics is available 48-96 hours after online publication and is updated daily on week days.
Initial download of the metrics may take a while.


