Fig. 1
Download original image
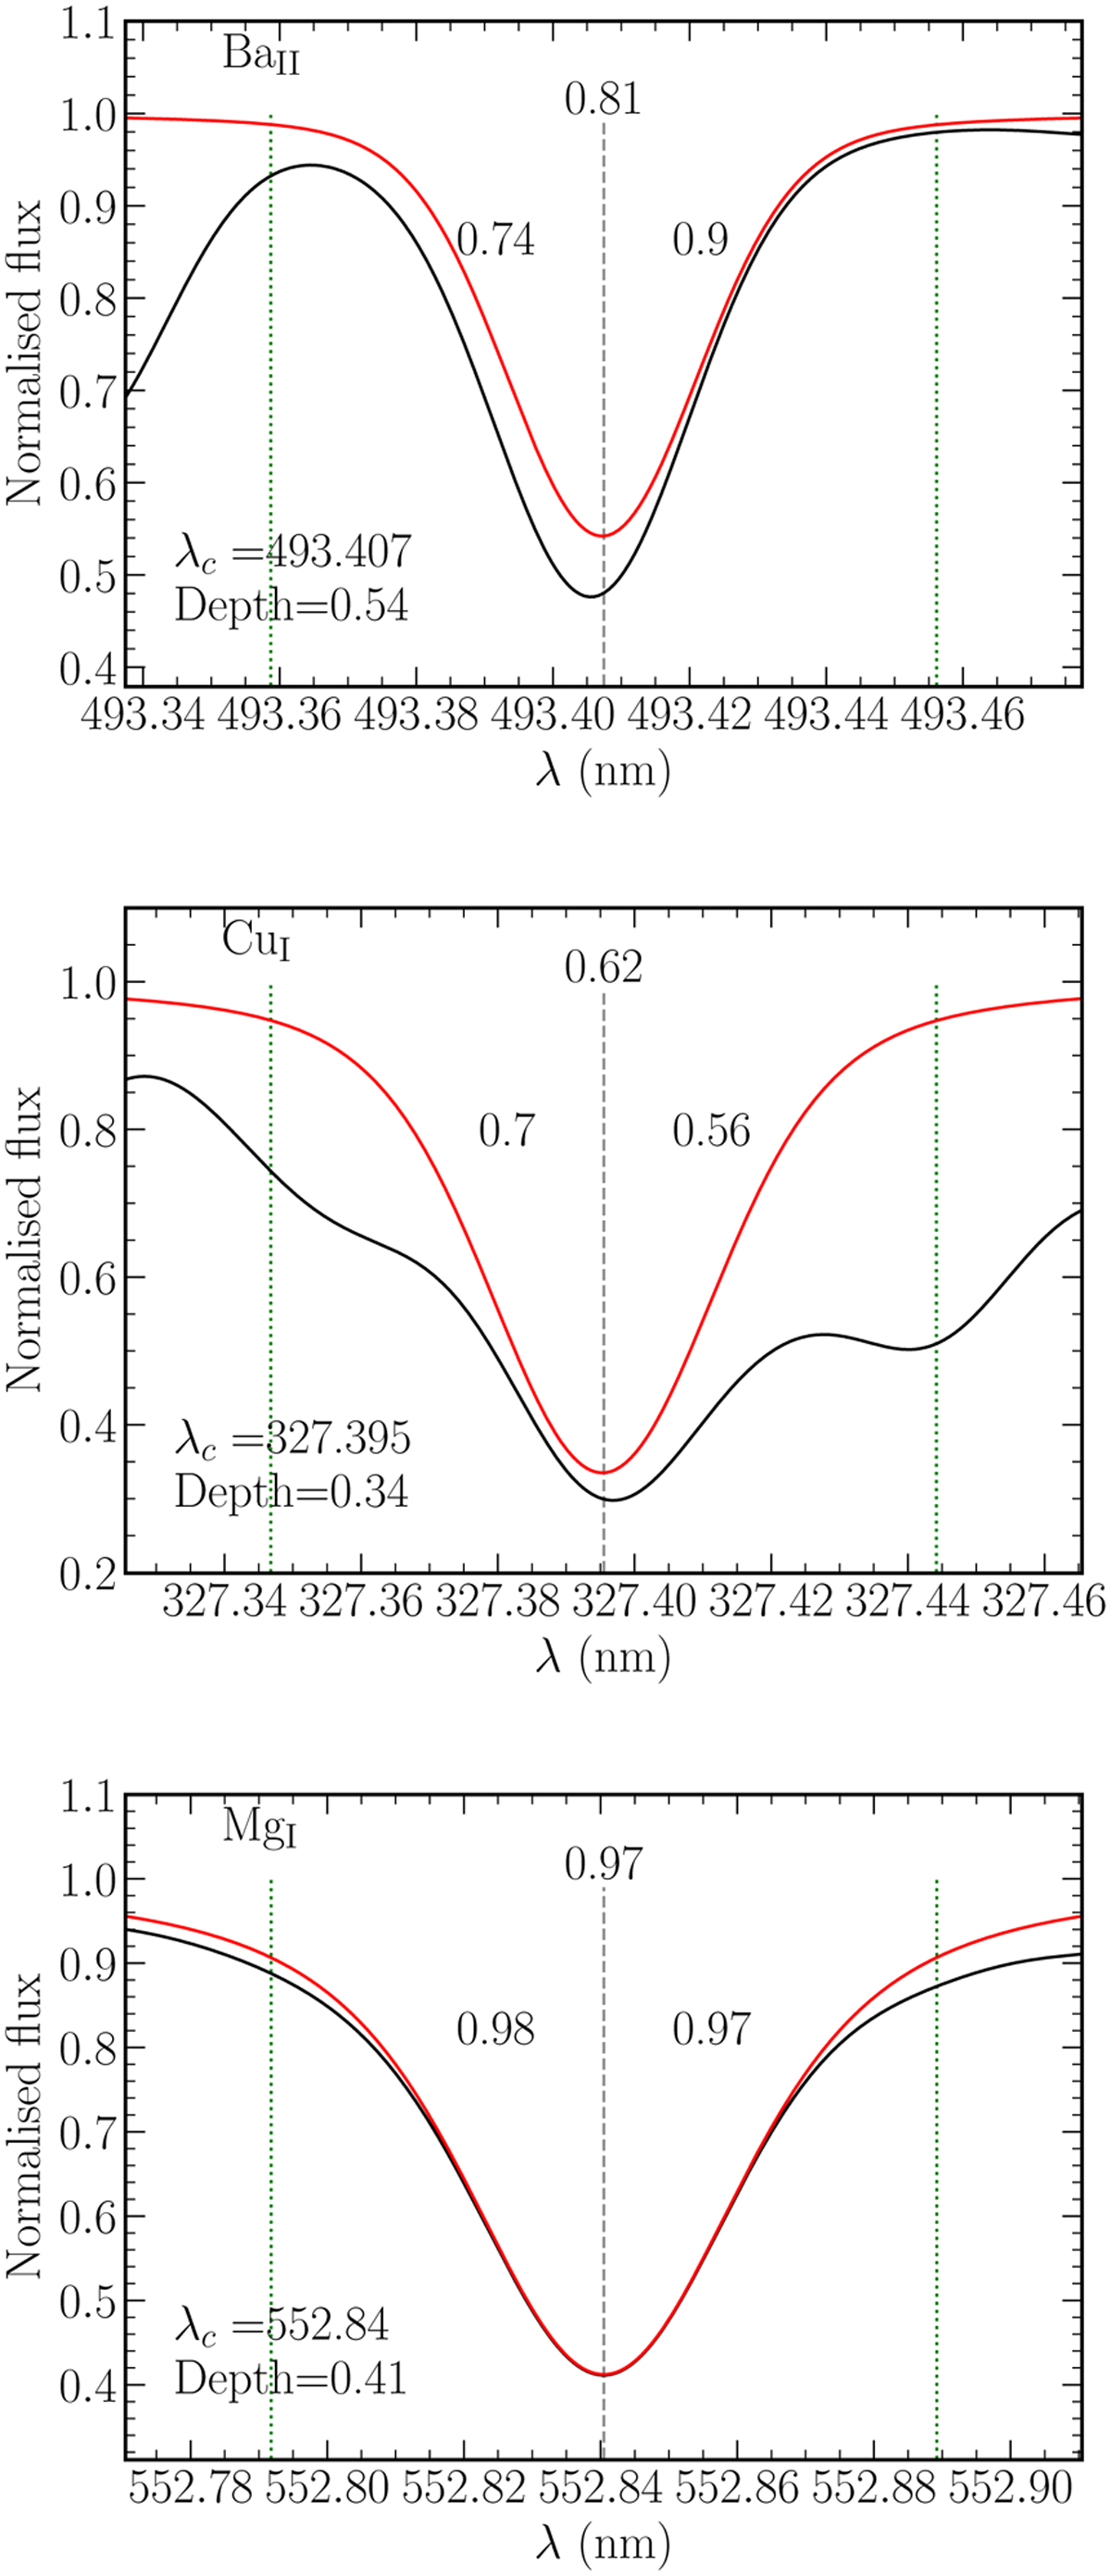
Examples of identified lines for a Solar-like spectrum at R = 20 000. The elemental spectrum, i.e. the flux computed with the contribution from atomic lines from only one ionization stage of one element, is plotted in red. The full spectrum containing all of the elements and molecules is shown in black. The element and ionization stage associated to the line are noted on the upper left corner of each plot. The central wavelength of the identified line, λc is plotted as a vertical dashed grey line. The blue-end and the red-end of the line are plotted as vertical dashed green lines. The depth of the line in the element spectrum is indicated at the bottom left corner of each plot. The purity factor for the entire line is written at the middle-top of the plots. The blue-wing and red-wing purities are enclosed within the line at its left and right, respectively.
Current usage metrics show cumulative count of Article Views (full-text article views including HTML views, PDF and ePub downloads, according to the available data) and Abstracts Views on Vision4Press platform.
Data correspond to usage on the plateform after 2015. The current usage metrics is available 48-96 hours after online publication and is updated daily on week days.
Initial download of the metrics may take a while.