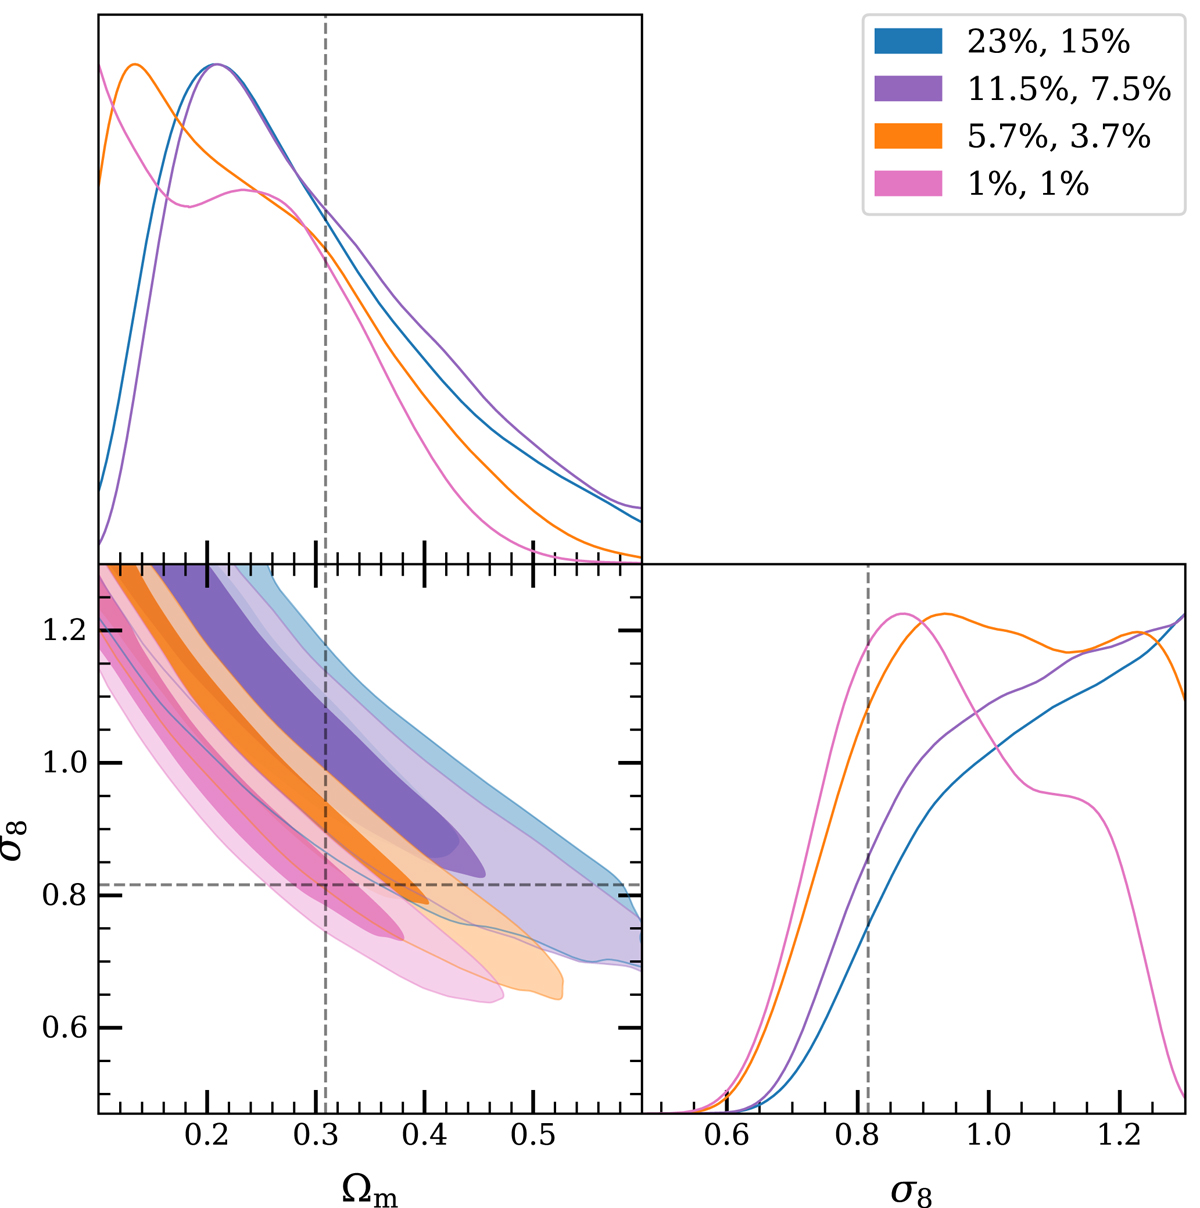
Fig. 7.
Download original image
Posterior distributions resulting from the analysis of a sample of 118 randomly selected haloes from the Uchuu simulation modelling measurement errors. Each contour corresponds to a model for the relative errors on clusters masses (δM200c, i/M200c, i, δM500c, i/M500c, i): in blue (23%, 15%) the magnitude of errors estimated for the CHEX-MATE sample; in purple (11.5%, 7.5%); in orange (5.7%, 3.7%); and in pink (1%, 1%). For the smallest errors the posterior from Fig. 6 is recovered where errors were neglected. Also seen is that a naive modelling of errors induces a bias towards increasingly large values of S8.
Current usage metrics show cumulative count of Article Views (full-text article views including HTML views, PDF and ePub downloads, according to the available data) and Abstracts Views on Vision4Press platform.
Data correspond to usage on the plateform after 2015. The current usage metrics is available 48-96 hours after online publication and is updated daily on week days.
Initial download of the metrics may take a while.