Fig. 6.
Download original image
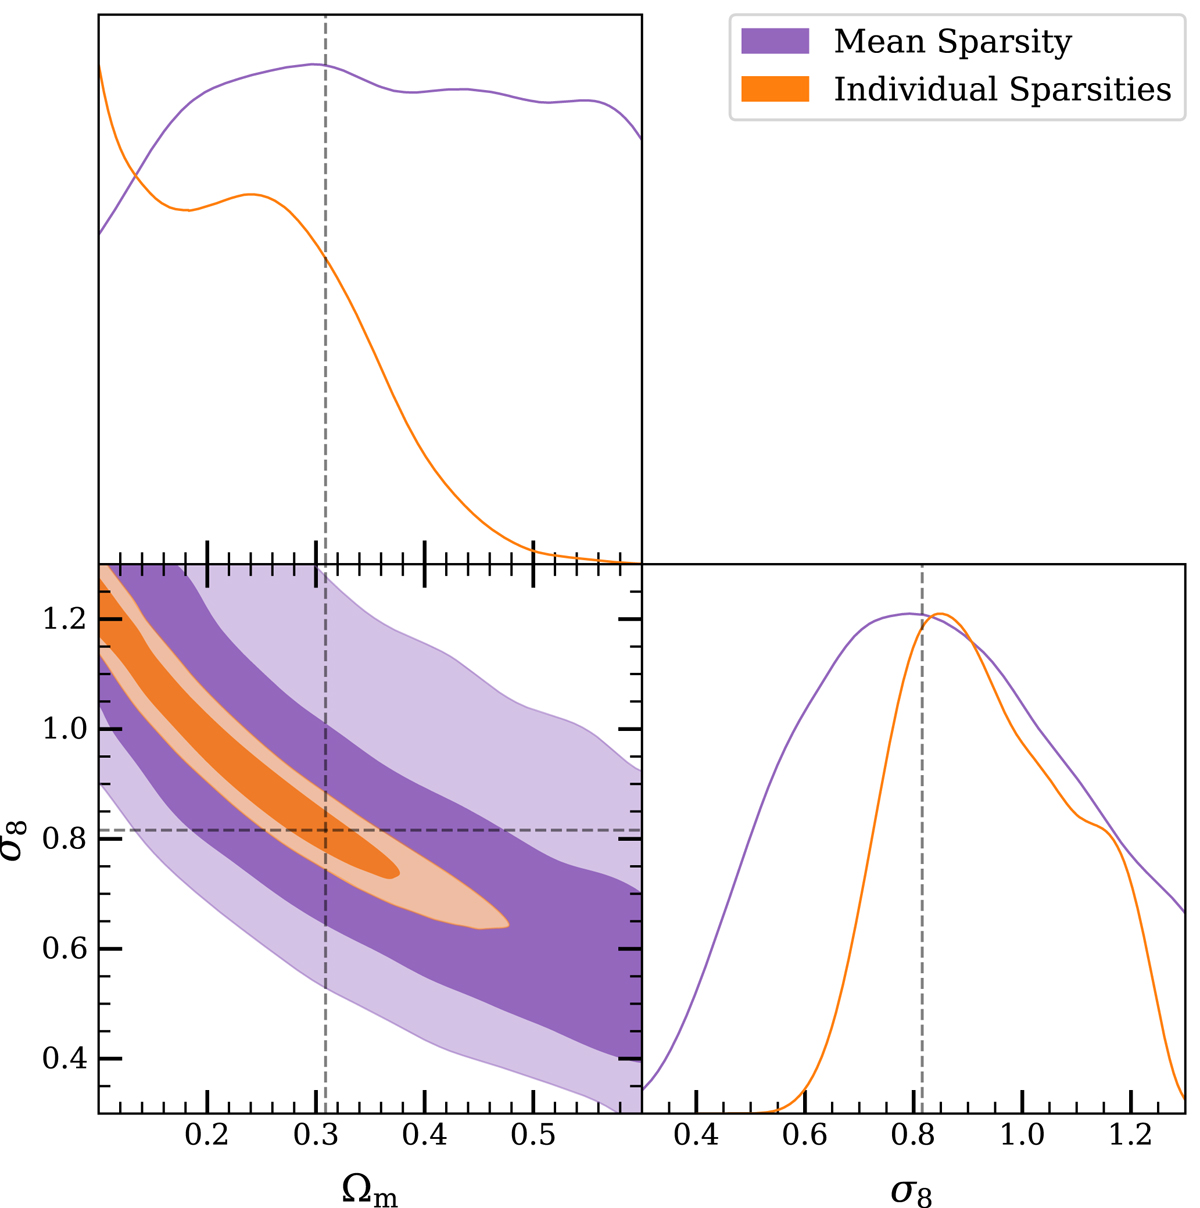
Posterior distributions resulting from the analysis of 118 randomly selected haloes from the Uchuu simulation. Shown in purple is the methodology of Corasaniti et al. (2018) that calculates the mean sparsity in Nz = 6 redshift bins and in orange the method where the haloes are treated as an individual data point (see Sect. 5). In both cases the same input information is used (i.e. the same 118 haloes and using the HMF definition of Despali et al. 2016). There is a clear increase in the constraining power when using the second method, this is simply due to avoiding the information loss that occurs when binning and calculating the mean sparsity.
Current usage metrics show cumulative count of Article Views (full-text article views including HTML views, PDF and ePub downloads, according to the available data) and Abstracts Views on Vision4Press platform.
Data correspond to usage on the plateform after 2015. The current usage metrics is available 48-96 hours after online publication and is updated daily on week days.
Initial download of the metrics may take a while.