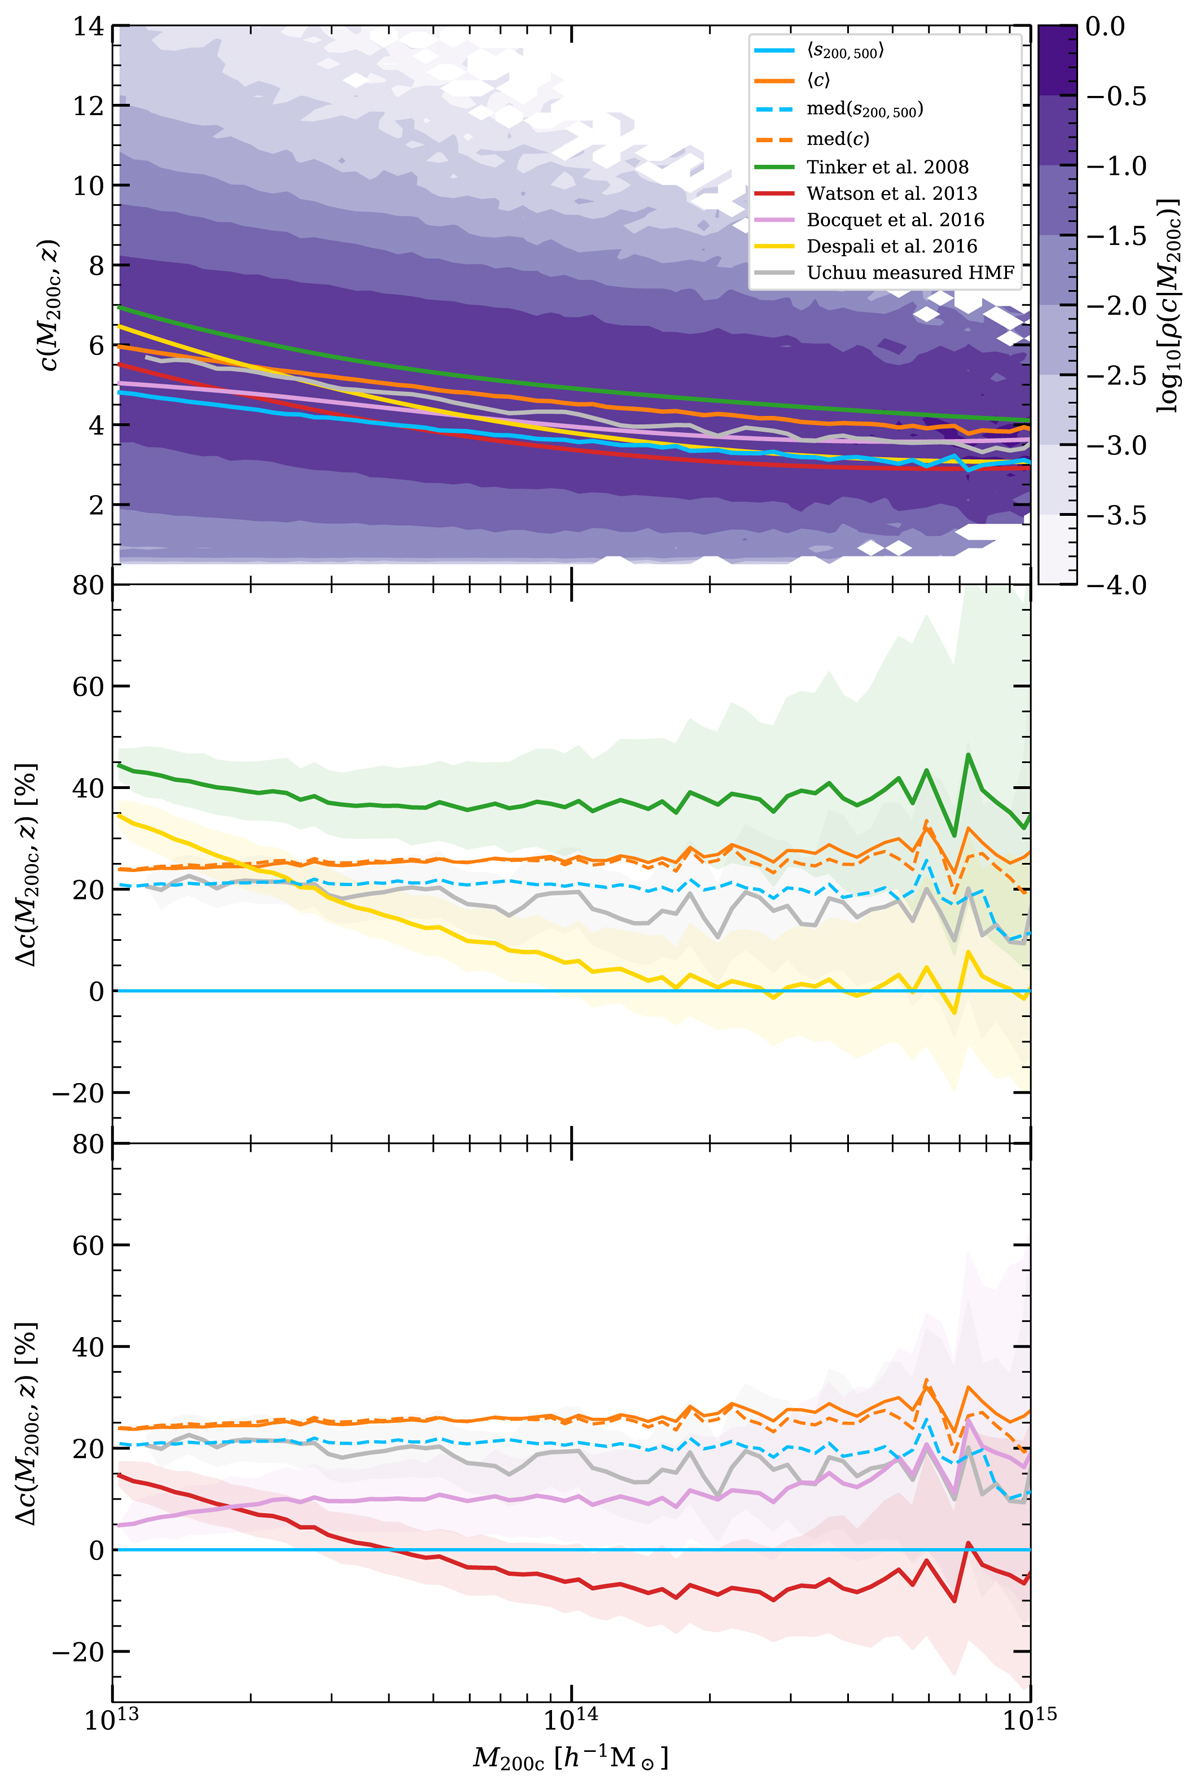
Fig. 4.
Download original image
Comparison of the concentration distribution inside the Uchuu simulation, measured c − M relation, and model predictions. Top panel: iso-contours of the conditional concentration c200c from the Uchuu halo catalogues at z = 0 as a function of M200c. The solid lines correspond to the mean c − M relation measured from the concentration (orange line) and mean sparsity s200, 500 (blue line) of the N-body haloes, and predicted from the measure HMF (grey lines) and HMFs models by Tinker et al. (2008) (green line), Watson et al. (2013) (red line), Bocquet et al. (2016) (pink line), and Despali et al. (2016) (yellow line). Middle and bottom panels: relative difference between the concentration mass relation predicted from the measured mean sparsity and that measured or predicted using other methods. The shaded area around each model represents one standard deviation around the latter assuming the statistical uncertainty of the HMF measured in the Uchuu simulation. Dashed lines represent the concentration-mass relation predicted from the median sparsity and concentration.
Current usage metrics show cumulative count of Article Views (full-text article views including HTML views, PDF and ePub downloads, according to the available data) and Abstracts Views on Vision4Press platform.
Data correspond to usage on the plateform after 2015. The current usage metrics is available 48-96 hours after online publication and is updated daily on week days.
Initial download of the metrics may take a while.