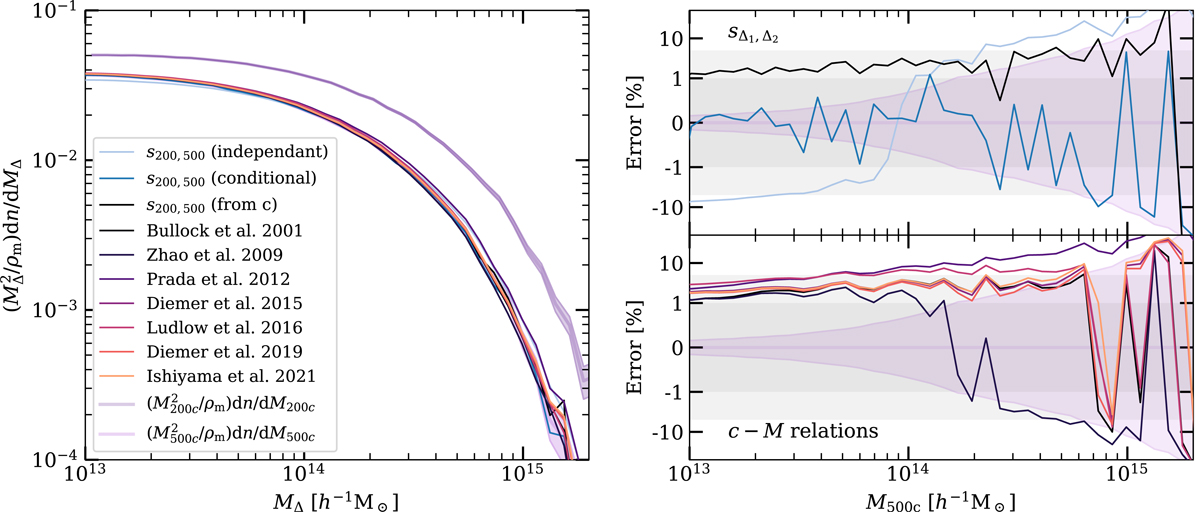
Fig. 3.
Download original image
Measuring the effectiveness of transforming the halo mass function from one density contrast to another assuming a c − M relation. Left panel: HMF at Δ1 = 200 (dark magenta line) and Δ2 = 500 (light magenta line) from the Uchuu halo catalogue at z = 0 against the reconstructed HMF at Δ2 = 500 obtained for the different c − M relation models shown in the legend (see text for further information). Right panel: relative error on these reconstructions. As in Fig. 1, the shaded areas around the measured HMFs represent the statistical error on the measurement estimated as the standard deviation over 103 bootstrap iterations.
Current usage metrics show cumulative count of Article Views (full-text article views including HTML views, PDF and ePub downloads, according to the available data) and Abstracts Views on Vision4Press platform.
Data correspond to usage on the plateform after 2015. The current usage metrics is available 48-96 hours after online publication and is updated daily on week days.
Initial download of the metrics may take a while.