Fig. 2.
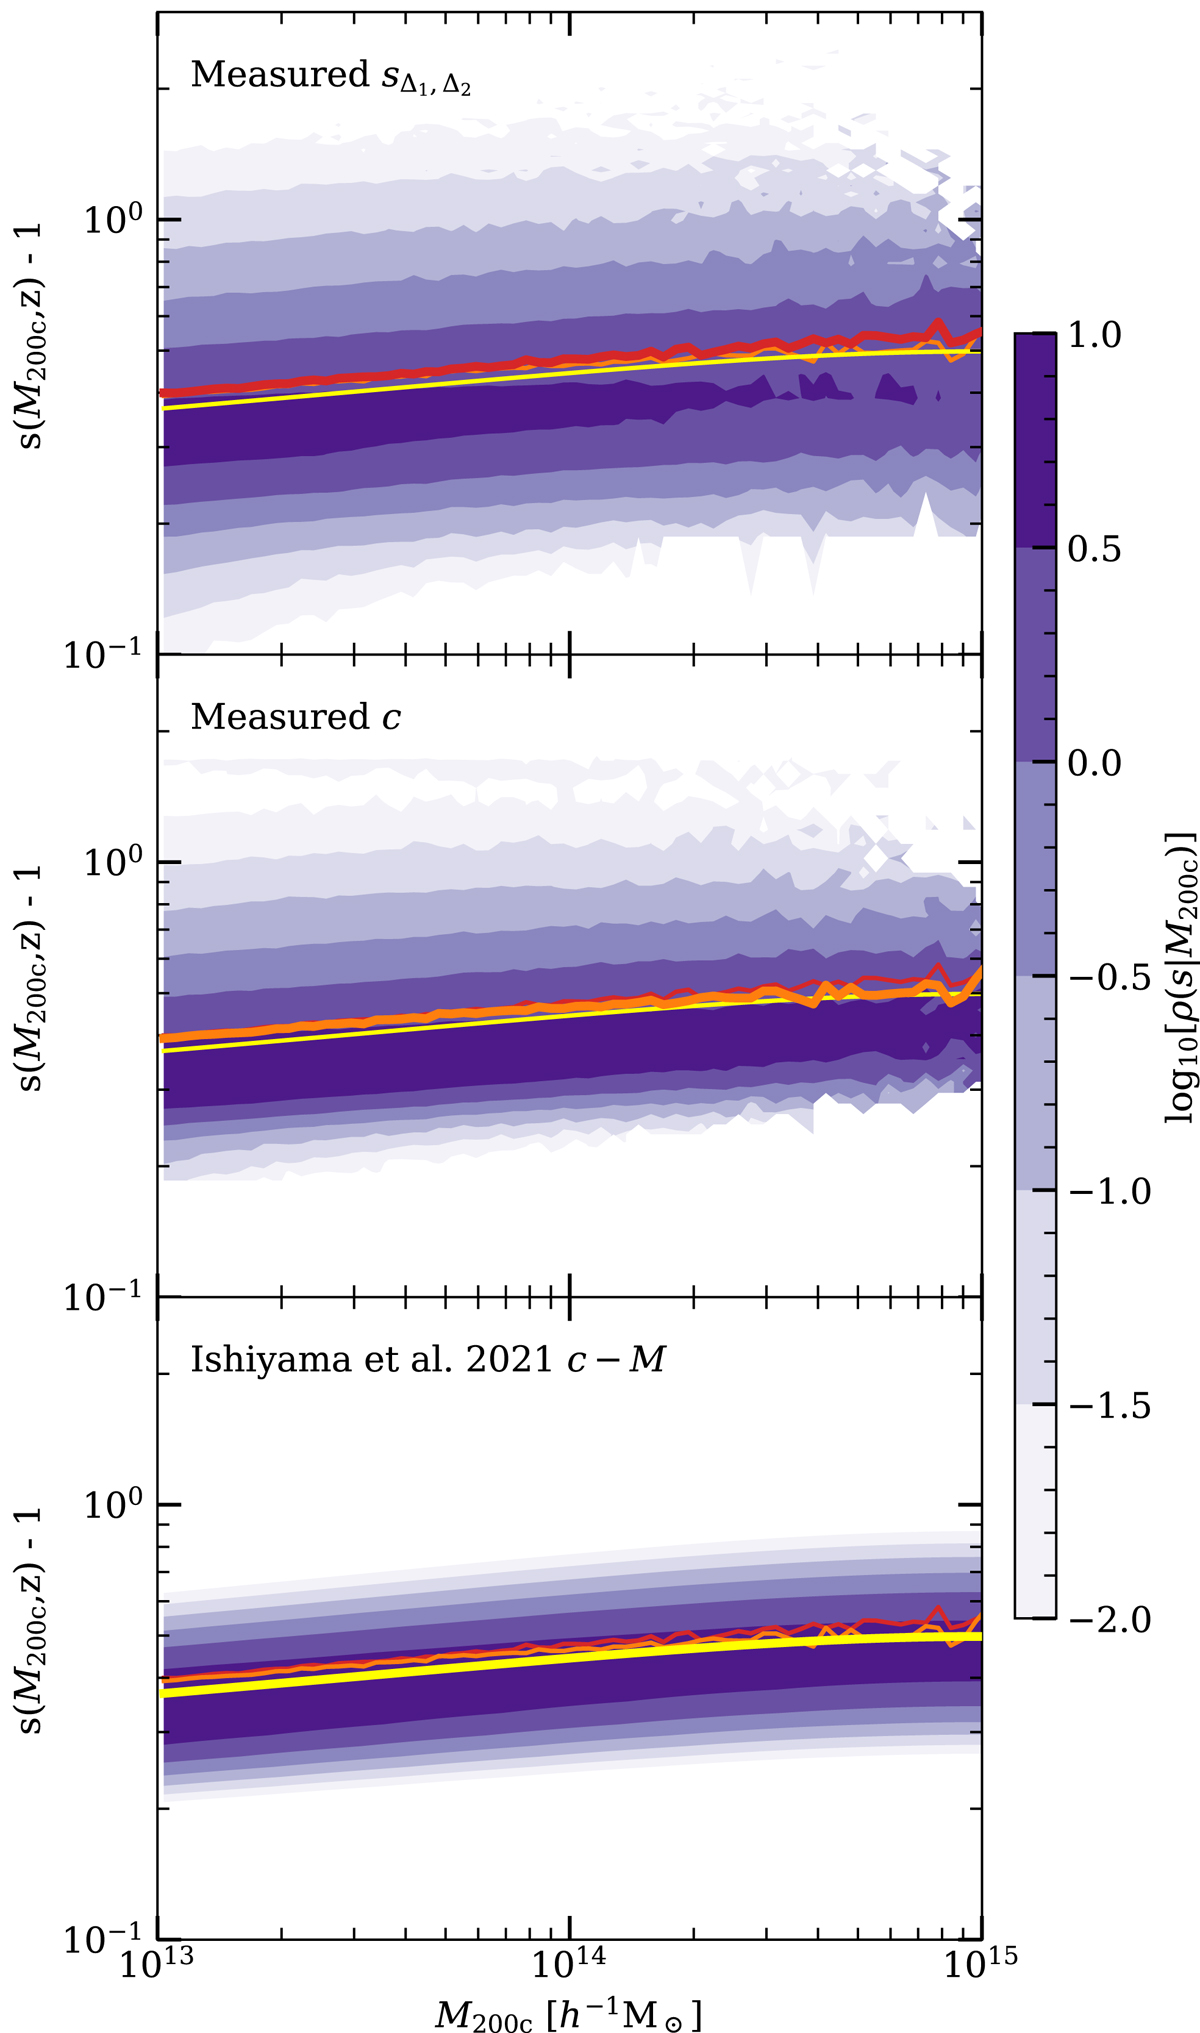
Download original image
Iso-contours of the conditional density distribution of the halo sparsity, ρ(s200,500|M200,c). Measurements are from the Uchuu halo catalogue at z = 0, (top panel), estimated from the distribution of measured concentrations (central panel), and predicted assuming a log-normal distribution of the concentration parameter for which the mean is given by the c − M relation of Ishiyama et al. (2021) calibrated on the Uchuu catalogues and width paramter σ = 0.25 (bottom panel). The coloured lines correspond to the mean of the distribution of measured sparsities (red), and that inferred from the measured concentrations (orange) and from the log-normal distribution (yellow).
Current usage metrics show cumulative count of Article Views (full-text article views including HTML views, PDF and ePub downloads, according to the available data) and Abstracts Views on Vision4Press platform.
Data correspond to usage on the plateform after 2015. The current usage metrics is available 48-96 hours after online publication and is updated daily on week days.
Initial download of the metrics may take a while.