Fig. 2.
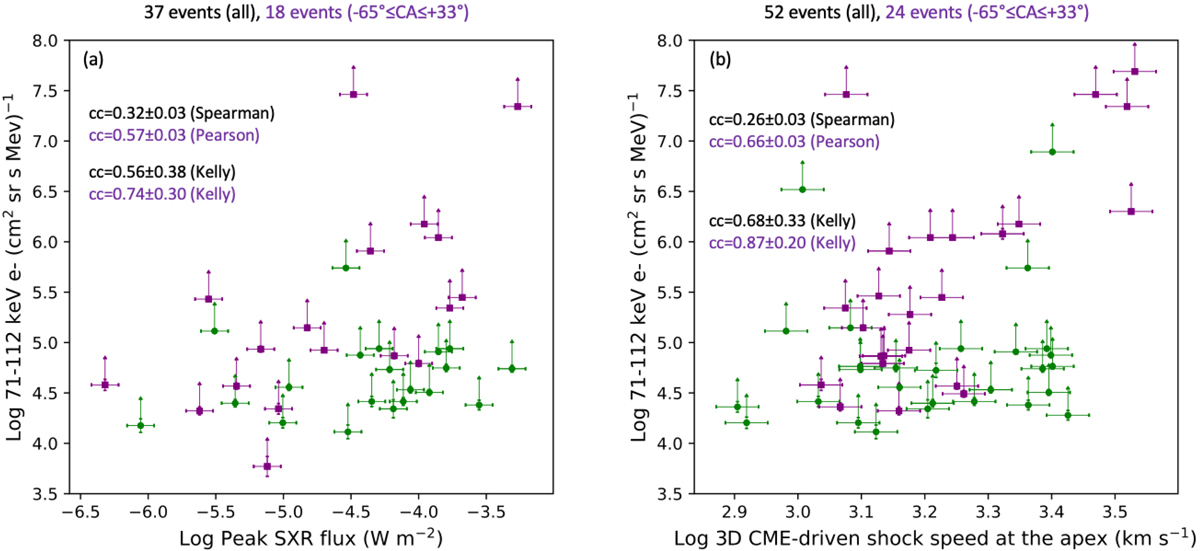
Download original image
Logarithm of the electron peak intensity against the logarithm of the flare intensity (a) and the logarithm of the maximum speed of the 3D CME-driven shock at the apex (b). The colour code of the points is the same as in Fig. 1a. All the points show the error bars corresponding to the uncertainties of the measurements. The vertical arrows over the points represent the error due to the anti-sunward pointing of the EPS instrument. The legend shows the number of events and the correlation coefficients corresponding to the full list of (well-connected) events in black (purple). Details given in the main text.
Current usage metrics show cumulative count of Article Views (full-text article views including HTML views, PDF and ePub downloads, according to the available data) and Abstracts Views on Vision4Press platform.
Data correspond to usage on the plateform after 2015. The current usage metrics is available 48-96 hours after online publication and is updated daily on week days.
Initial download of the metrics may take a while.