Fig. 1.
Download original image
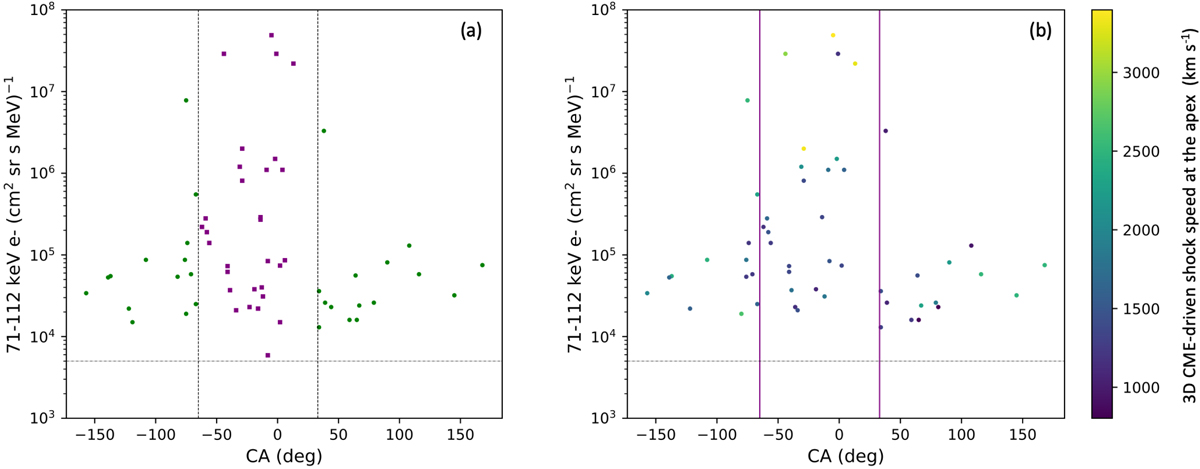
MESSENGER solar energetic electron peak intensities versus CA. The vertical dashed lines indicate the connection angles CA = −65° (left) and CA = +33° (right). The horizontal lines show the truncation level of the sample. (a) Includes all SEE events selected for the study. The colour of the points depends on the CA. The purple square points correspond to the sample of well-connected events, namely −65° ≤ CA ≤ +33°. The rest of the sample is indicated with green circles. (b) Only events accompanied by a CME-driven shock are shown, and these are colour-coded according to the shock speed at the apex.
Current usage metrics show cumulative count of Article Views (full-text article views including HTML views, PDF and ePub downloads, according to the available data) and Abstracts Views on Vision4Press platform.
Data correspond to usage on the plateform after 2015. The current usage metrics is available 48-96 hours after online publication and is updated daily on week days.
Initial download of the metrics may take a while.