Fig. 3

Download original image
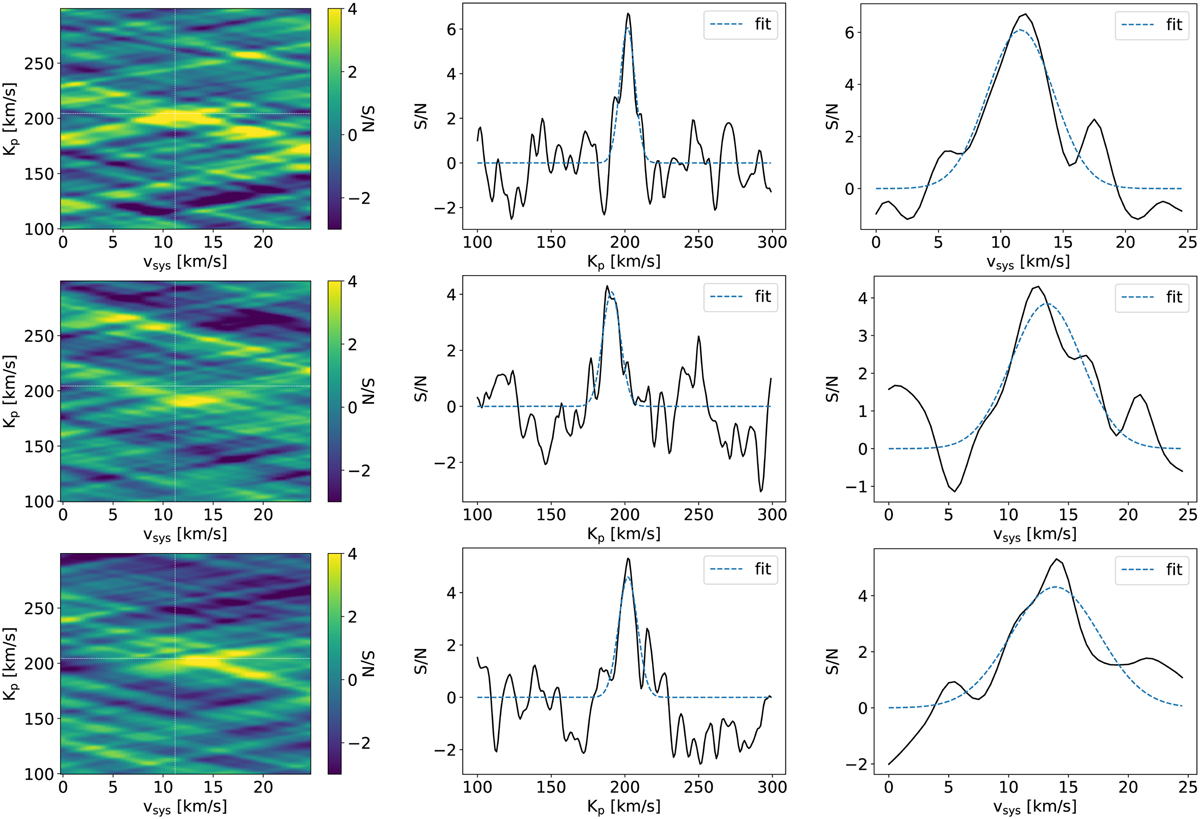
Atmospheric planetary signal obtained with the Fe I, Cr I, and Ti I templates (top, central, and bottom row, respectively). The left column shows the Kp-υsys bi-dimensional map, with the color bar encoding the significance of the detection. The cross in white dashes marks the position where the planetary signal is expected according to Table 1. The central (right) column shows the cut along the vertical (horizontal) direction on the map and corresponding to the peak detection, together with its Gaussian best fit (dashed blue line).
Current usage metrics show cumulative count of Article Views (full-text article views including HTML views, PDF and ePub downloads, according to the available data) and Abstracts Views on Vision4Press platform.
Data correspond to usage on the plateform after 2015. The current usage metrics is available 48-96 hours after online publication and is updated daily on week days.
Initial download of the metrics may take a while.


