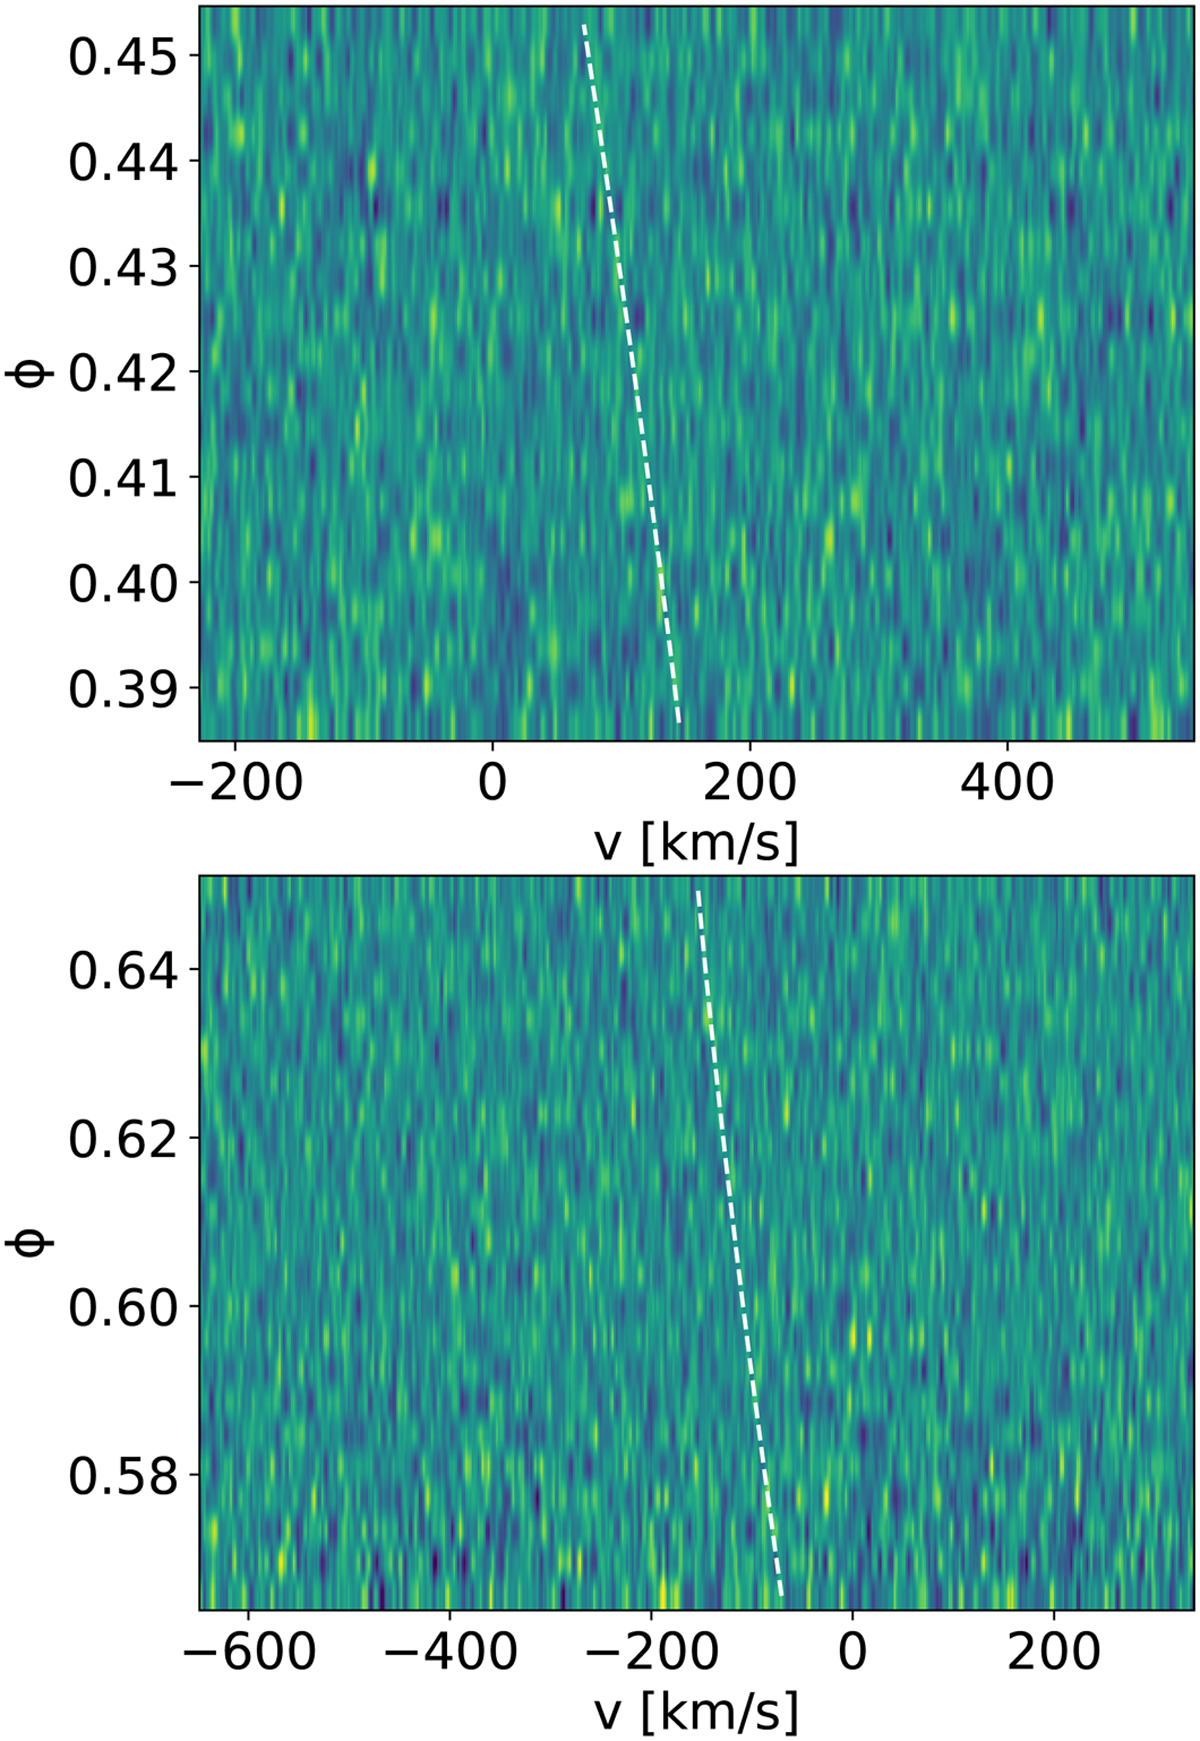
Fig. 2
Download original image
CCFs of the planetary emission spectrum for nights N1 (top panel) and N2 (bottom panel) as a function of the planetary orbital phase. The CCFs shown in these plots were computed using the Fe I spectral template, for which we claim the strongest detection (see Table 4). In each panel, the dashed white line marks where the planetary emission signal is expected according to the system parameters in Table 1. The emission trace is not obvious in this 2D plot and is only detected significantly in the Kp–υsys map, as shown in Fig. 3.
Current usage metrics show cumulative count of Article Views (full-text article views including HTML views, PDF and ePub downloads, according to the available data) and Abstracts Views on Vision4Press platform.
Data correspond to usage on the plateform after 2015. The current usage metrics is available 48-96 hours after online publication and is updated daily on week days.
Initial download of the metrics may take a while.