Fig. 4.
Download original image
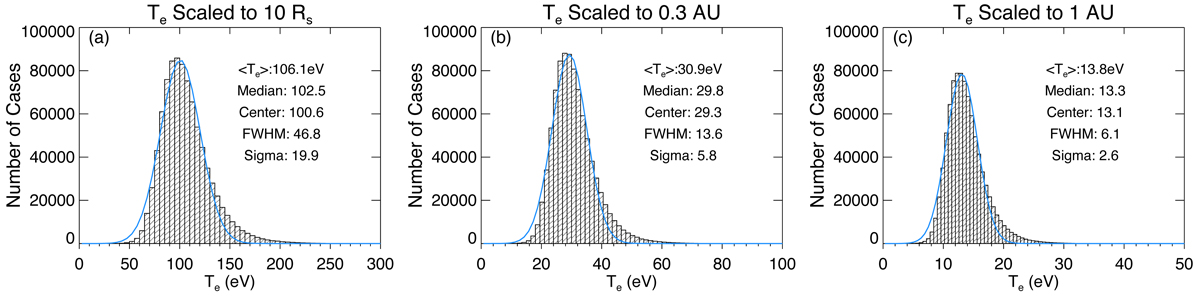
(a–c): Histograms of the total electron temperature (Te) scaled to 10 solar radii, 0.3 AU and 1 AU, based on observations displayed in Fig. 3 and their corresponding power law modelling fit results. Gaussian fit is superimposed in blue on each histogram. The corresponding average and median values are also indicated together with the center value and 1-σ standard deviation of the Gaussian fit.
Current usage metrics show cumulative count of Article Views (full-text article views including HTML views, PDF and ePub downloads, according to the available data) and Abstracts Views on Vision4Press platform.
Data correspond to usage on the plateform after 2015. The current usage metrics is available 48-96 hours after online publication and is updated daily on week days.
Initial download of the metrics may take a while.