Fig. 2.
Download original image
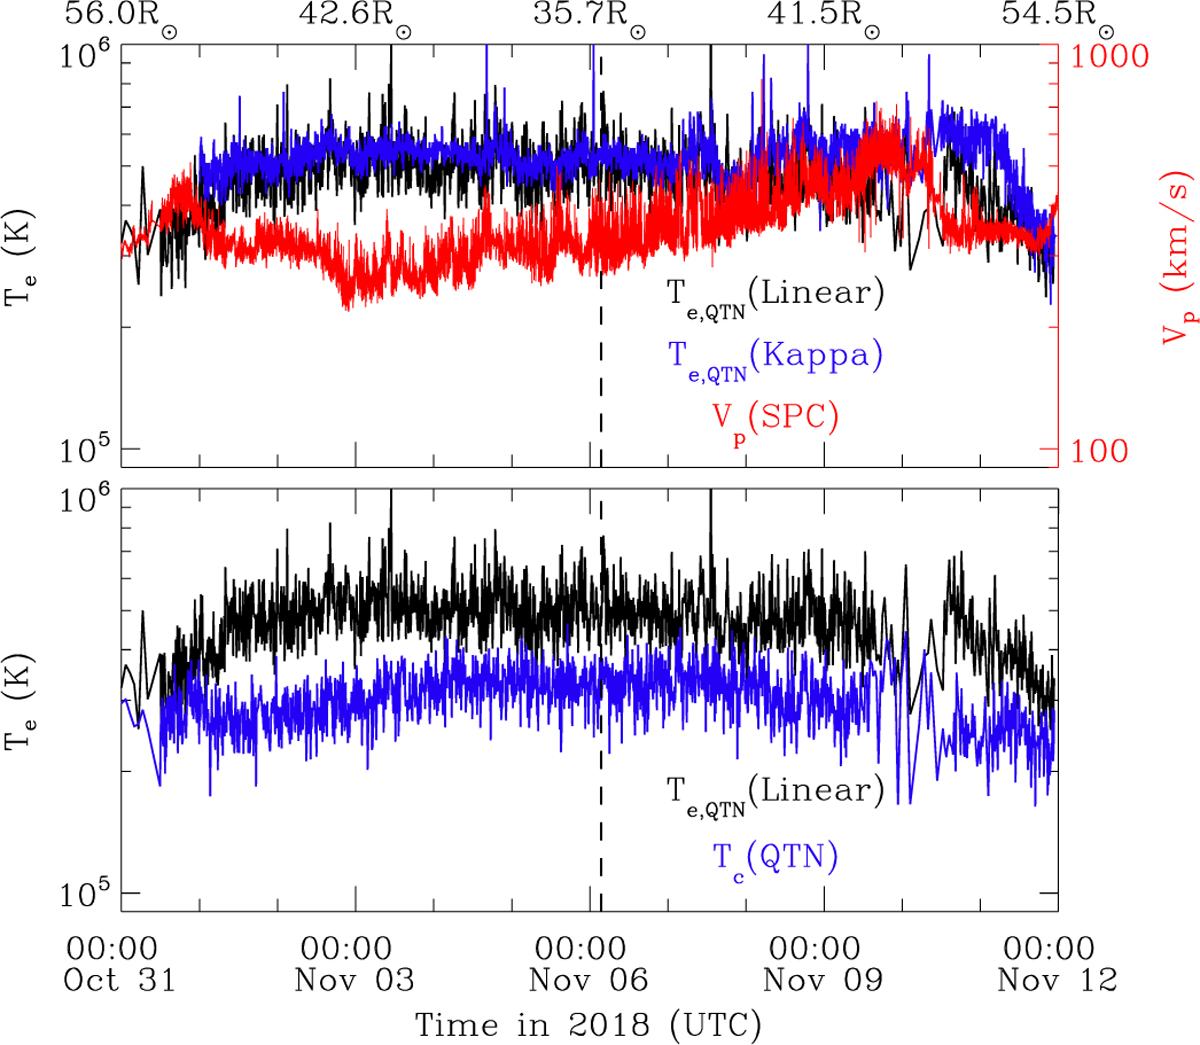
Comparison of observations of solar wind electron temperatures derived from different methods from PSP. An example of 12-day period of measurements from PSP during encounter one (from October 31, 2018 00:00:00 to November 12, 2018 00:00:00 UTC) is shown for reference. The heliocentric distance (in units of the solar radius R⊙) is indicated at the top of the top panel and the black vertical line denotes the first perihelion of the PSP orbit. From the top to bottom panels, the total electron temperature derived from the linear fit QTN technique is displayed in black. In the top panel, the total electron temperature obtained by fitting the high-frequency part of the spectrum with the generalized Lorentzian QTN model (Maksimovic et al. 2020) is shown in blue for comparison. The bottom panel follows the same format as the first panel but for the core electron temperature derived from the simplified QTN technique (Moncuquet et al. 2020). The proton bulk speed from SPC/SWEAP is presented in the top panel for reference. An anticorrelation between Vp and Te, which was also previously reported in Maksimovic et al. (2020), is visible during the time interval considered. We note that we have already smoothed Te, QTN(linear), Tc, QTN, and Te, QTN(kappa), so that the comparison between them is clear.
Current usage metrics show cumulative count of Article Views (full-text article views including HTML views, PDF and ePub downloads, according to the available data) and Abstracts Views on Vision4Press platform.
Data correspond to usage on the plateform after 2015. The current usage metrics is available 48-96 hours after online publication and is updated daily on week days.
Initial download of the metrics may take a while.