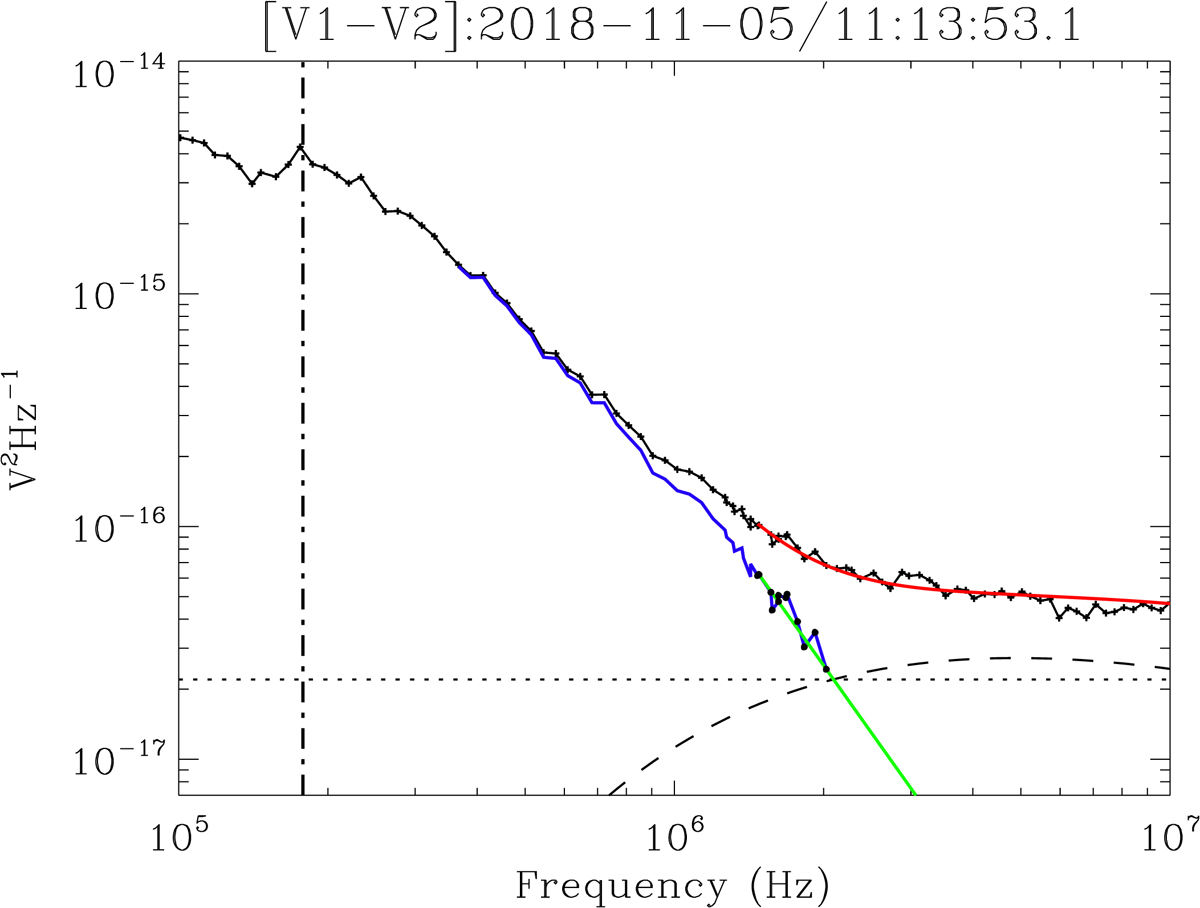
Fig. 1.
Download original image
Example of a voltage power spectrum (between 100 kHz and 10 MHz) recorded by the RFS receiver using the |V1 − V2| dipole electric antennas from FIELDS instrumentation (full black curve connected by crosses). Dot-dashed line gives the position of the local plasma peak (Moncuquet et al. 2020). Dotted horizontal line represents the pre-deployment RFS instrument noise (after launch) of ∼2.2 × 10⁻¹⁷ V2 Hz−1. Black dashed line shows the modelled radio galaxy noise. Blue and green lines represent the effective QTN signal and linear fit (f−3 variation that the QTN spectrum should follow when f ≫ fpLD/L), respectively. Black dots on the blue line are used to derive the linear fit. Red line is the sum of the fitted QTN signal, the modelled radio galaxy noise, and the instrument noise. More details are given in the text.
Current usage metrics show cumulative count of Article Views (full-text article views including HTML views, PDF and ePub downloads, according to the available data) and Abstracts Views on Vision4Press platform.
Data correspond to usage on the plateform after 2015. The current usage metrics is available 48-96 hours after online publication and is updated daily on week days.
Initial download of the metrics may take a while.