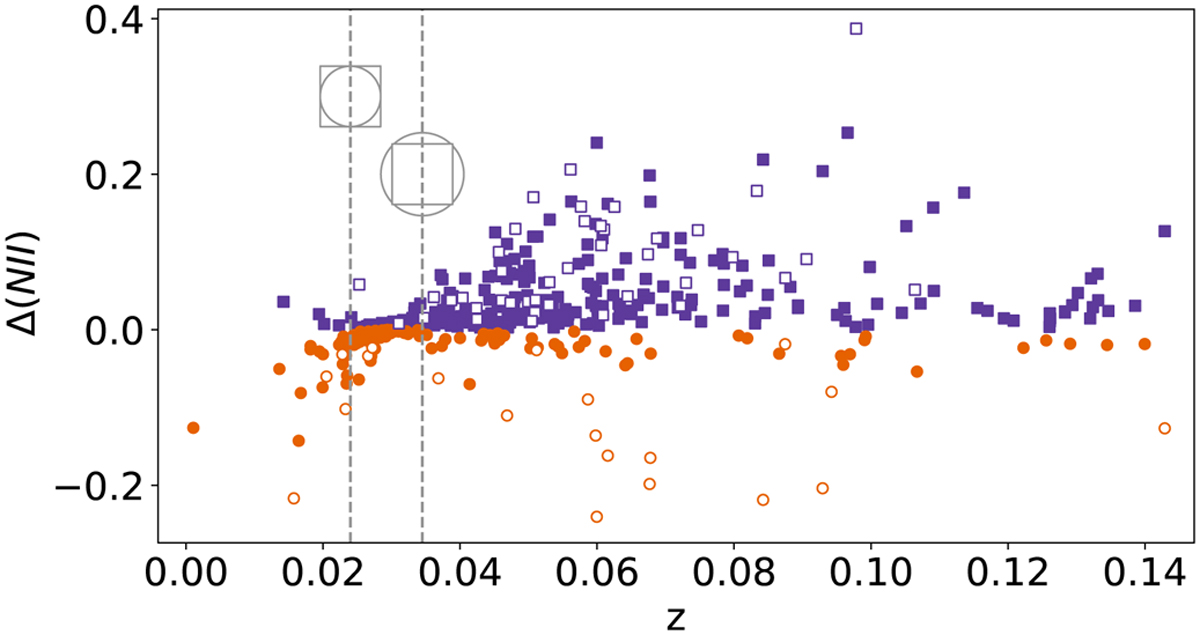
Fig. 9
Download original image
Magnitude of the offset between the position of a 3″ and 2 kpc aperture in the [NII]–BPT diagram as a function of the redshift of the target. The data displayed in this plot correspond to the Δ(NII) from AGN-selected galaxies using a 2 kpc aperture (and excluding the [O I] BPT diagram). Orange solid circles correspond to galaxies whose offset slope points towards the AGN BPT region (outside the HII-BPT region). In contrast, the solid purple circles correspond to the opposite, moving galaxies towards a more star-forming appearance. Empty symbols (squares or circles) correspond to galaxies that were selected as AGN in one aperture but not in the other (e.g., the empty squares are exactly the same objects that are shown in Fig. 5, meaning that they were selected as AGN by the 2 kpc aperture but not for the 3″ aperture). The dashed vertical lines correspond to the redshift values where the squared arcsecond aperture corresponds to the circumscribed and inscribed square of a circle of radius 1 kpc.
Current usage metrics show cumulative count of Article Views (full-text article views including HTML views, PDF and ePub downloads, according to the available data) and Abstracts Views on Vision4Press platform.
Data correspond to usage on the plateform after 2015. The current usage metrics is available 48-96 hours after online publication and is updated daily on week days.
Initial download of the metrics may take a while.