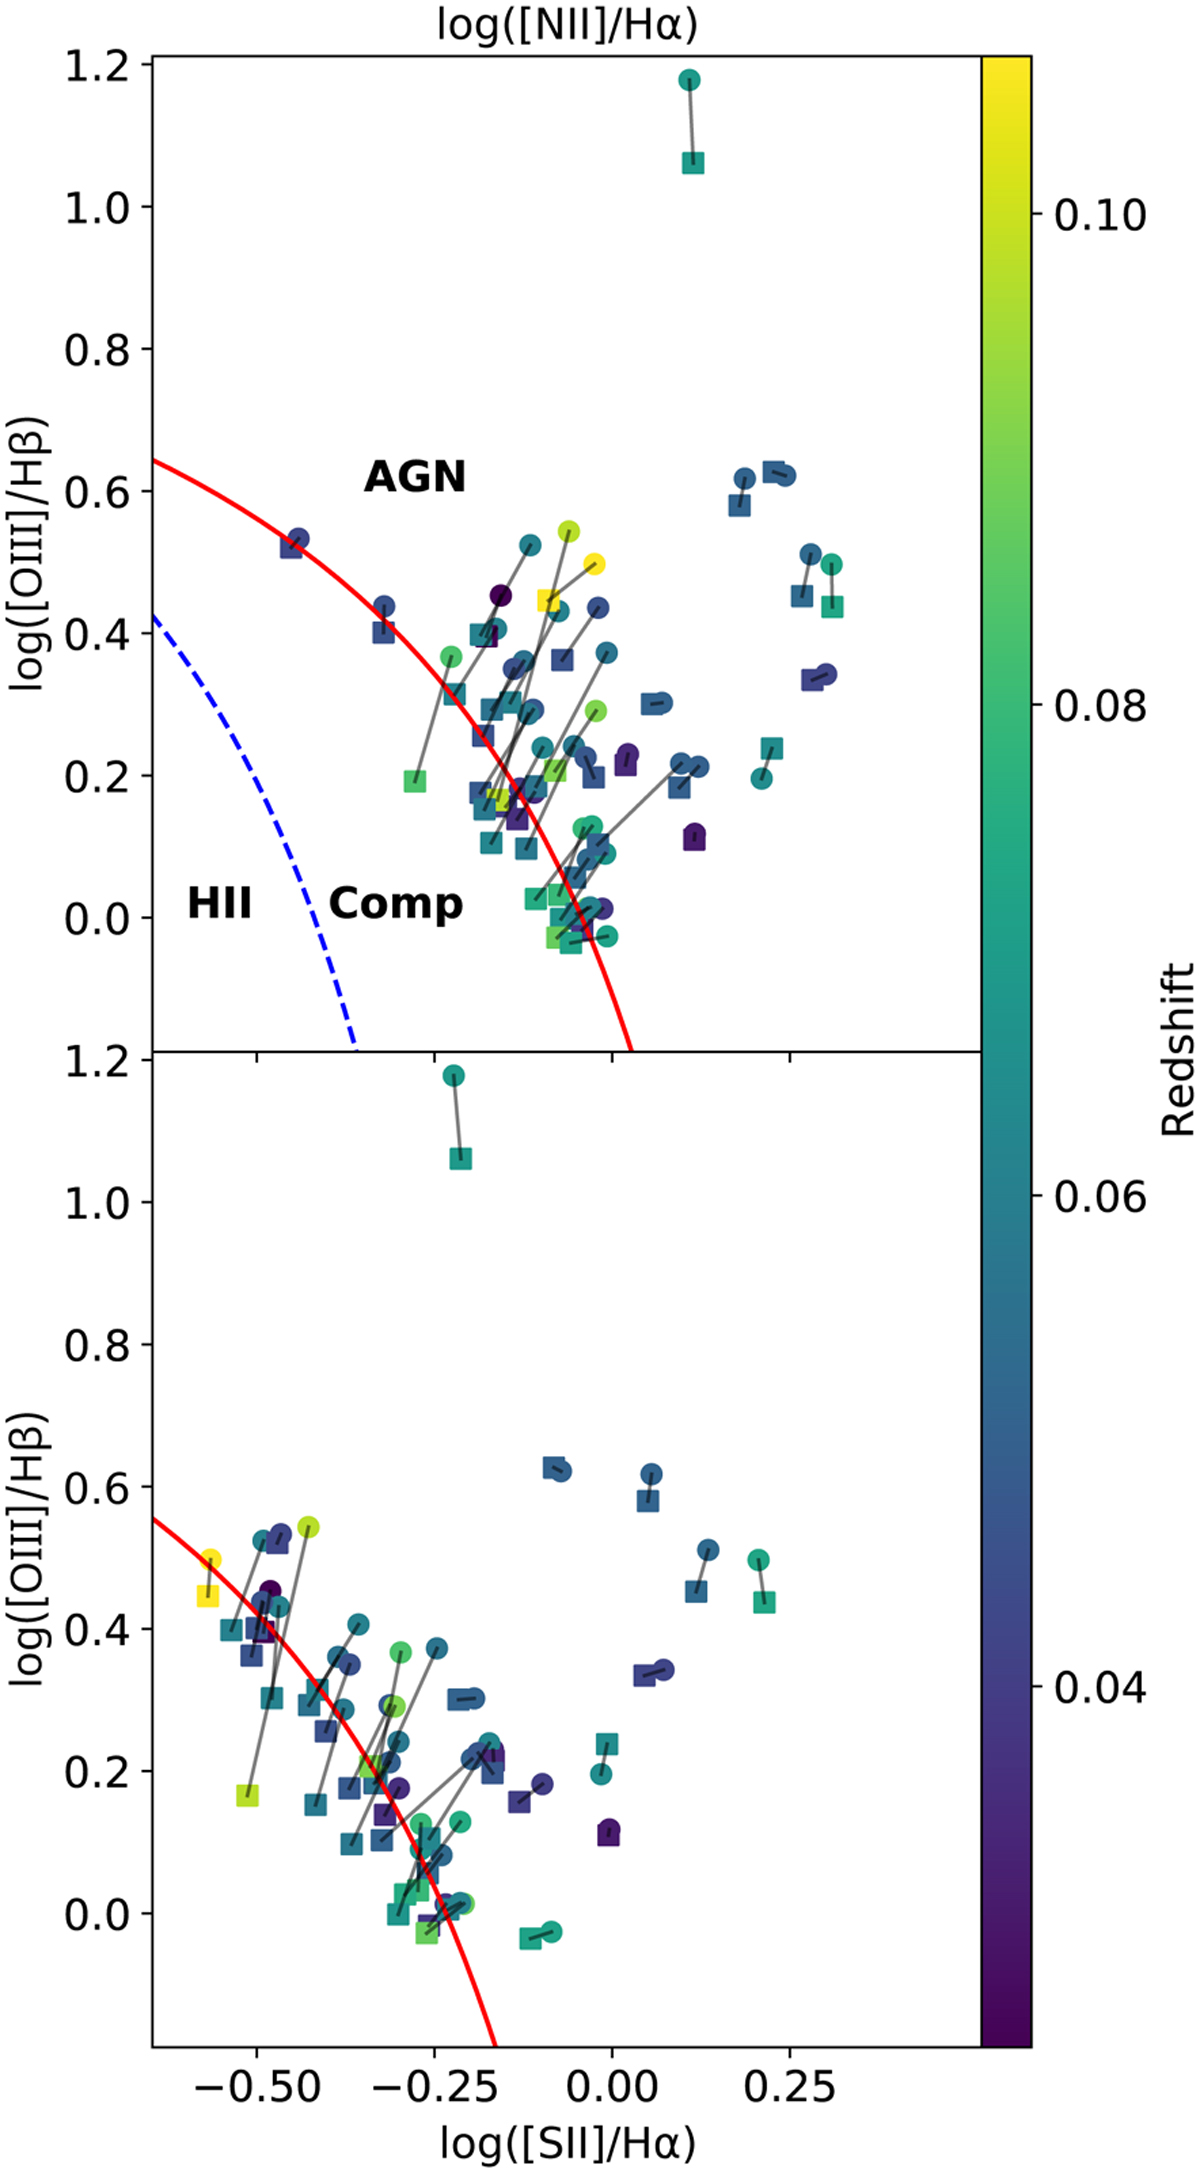
Fig. 8

Download original image
BPT distribution for galaxies that were selected by the 2 kpc aperture (circles) but not by the 3″ × 3″ aperture (squares); each pair is connected by a black line. Both catalogs are performed as in Sect. 3.2, with the [OI]/Hα diagram being excluded. Each target is colored by its redshiſt. We plot the empirical division lines that will give each target a specific classification (e.g., AGN-like galaxy, composite object, or HII-star-forming galaxies): red lines correspond to Kewley et al. (2001), and the blue dashed line in the top plot corresponds to Kauffmann et al. (2003a).
Current usage metrics show cumulative count of Article Views (full-text article views including HTML views, PDF and ePub downloads, according to the available data) and Abstracts Views on Vision4Press platform.
Data correspond to usage on the plateform after 2015. The current usage metrics is available 48-96 hours after online publication and is updated daily on week days.
Initial download of the metrics may take a while.


