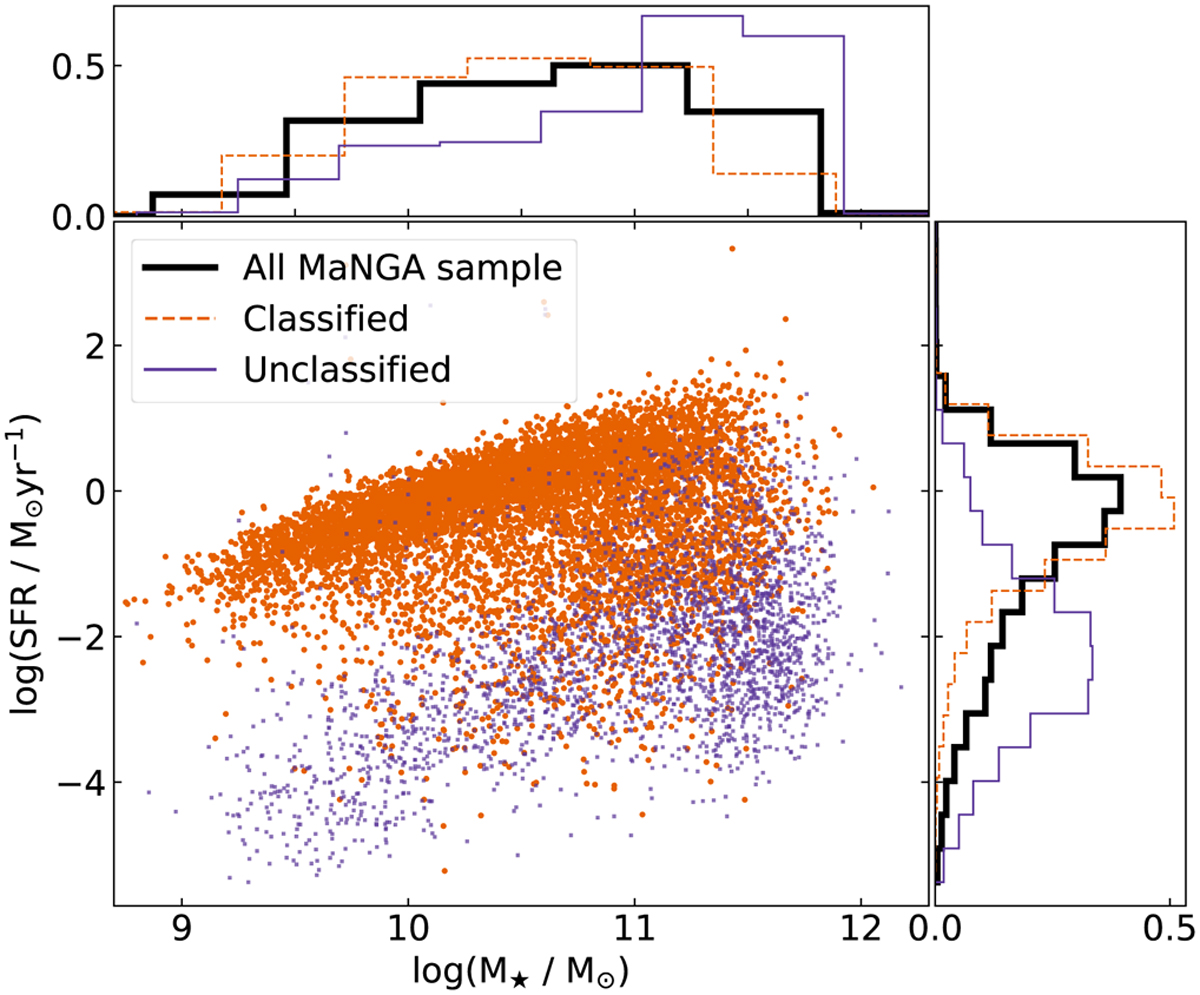
Fig. 6
Download original image
Stellar mass vs. star formation rate (derived from Hα) extracted from the Pipe3D (Sánchez et al. 2016) value-added catalog. We color each target in orange or purple on the scatterplot to show whether or not, respectively, that specific galaxy was considered in the BPT classification scheme (meaning that it met our S/N criteria specified in Sect. 3.1). This plot is based on the classification using a 2 kpc aperture without considering the [O I] BPT diagram. The histograms show the distributions of stellar mass (top) and star formation rate (right). Distributions for the BPT classified and unclassified galaxies correspond to the dashed and solid histograms, respectively. The distribution of the whole MaNGA sample is shown in the black bold histogram. The distributions of the histograms are normalized, and the y-axis in the histograms corresponds to the normalized counts.
Current usage metrics show cumulative count of Article Views (full-text article views including HTML views, PDF and ePub downloads, according to the available data) and Abstracts Views on Vision4Press platform.
Data correspond to usage on the plateform after 2015. The current usage metrics is available 48-96 hours after online publication and is updated daily on week days.
Initial download of the metrics may take a while.