Fig. 5
Download original image
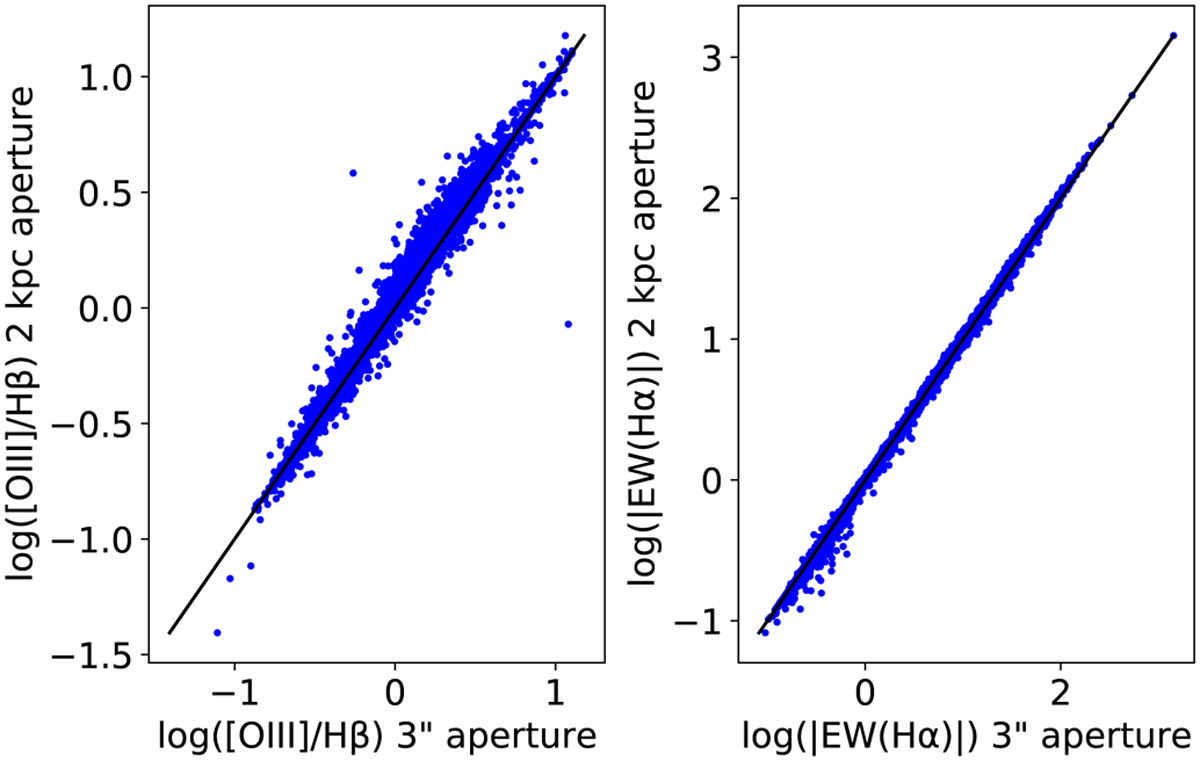
Comparison of EW(Hα) and [OIII]/Hβ measurements derived from an aperture of 2 kpc and 3″ × 3″, respectively. Filled blue circles correspond to a comparison between measurements of EW(Hα) (right-hand plot) and [OШ]/Hβ ratio (left-hand plot) from our 2 kpc aperture (y-axis) and 3″ × 3″ aperture (x-axis). The measurements shown here correspond to the full MaNGA sample. The solid black line in both plots shows the one-to-one ratio that the values should follow if they have the same value.
Current usage metrics show cumulative count of Article Views (full-text article views including HTML views, PDF and ePub downloads, according to the available data) and Abstracts Views on Vision4Press platform.
Data correspond to usage on the plateform after 2015. The current usage metrics is available 48-96 hours after online publication and is updated daily on week days.
Initial download of the metrics may take a while.