Fig. 4
Download original image
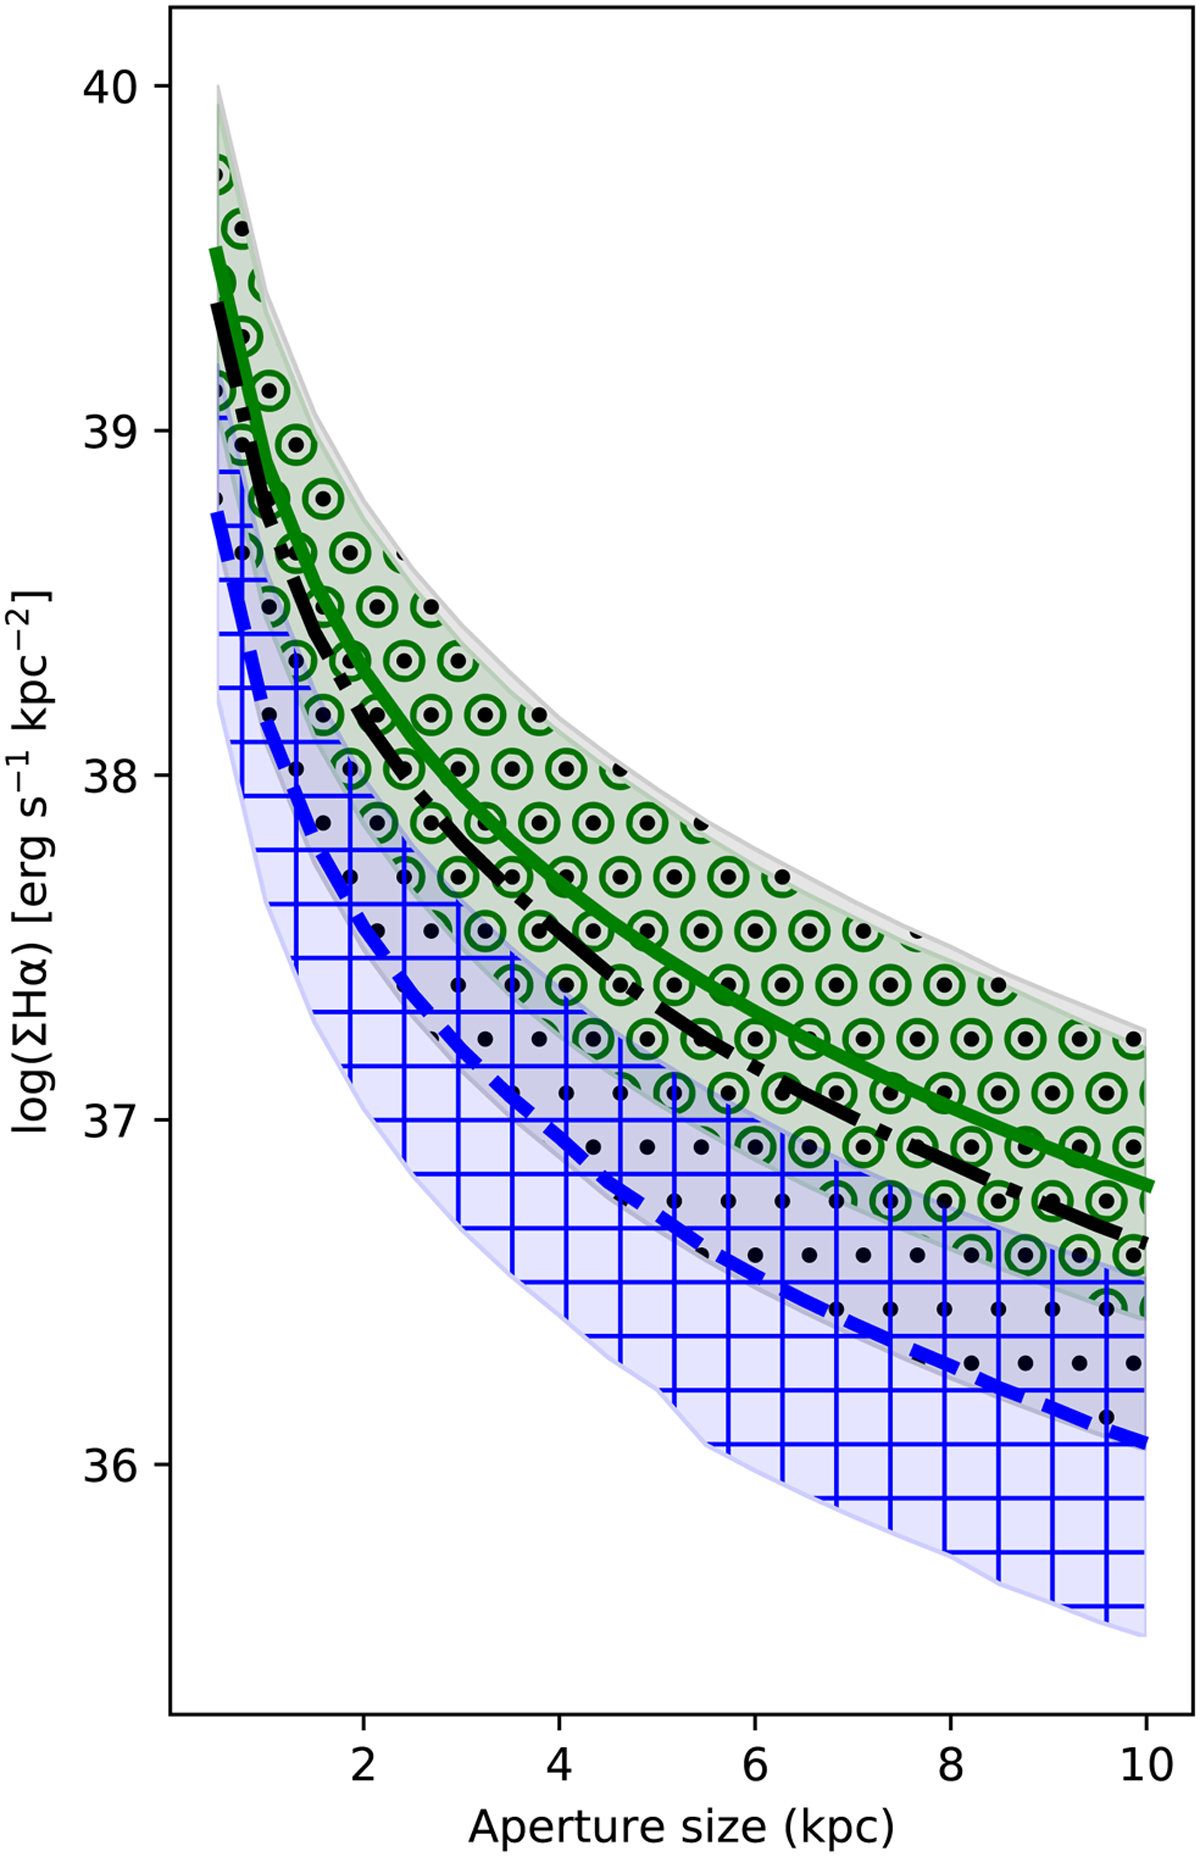
Average radial profiles of the Hα surface brightness stacked according to specific AGN candidates. The shaded regions correspond to the 16th and 84th percentiles of each stacked radial profile. The solid green line corresponds to the AGN selected using a 2 kpc circular aperture, and its shaded area is filled with hollow circles. The black dash-dot line corresponds to the AGN selected by an aperture of 10 kpc, and its shaded area is filled with dots. Finally, the blue dashed line corresponds to the AGN selected by the 10 kpc aperture but excludes the AGN selected by the 2 kpc aperture. The last line has a shaded area filled with hollow squares.
Current usage metrics show cumulative count of Article Views (full-text article views including HTML views, PDF and ePub downloads, according to the available data) and Abstracts Views on Vision4Press platform.
Data correspond to usage on the plateform after 2015. The current usage metrics is available 48-96 hours after online publication and is updated daily on week days.
Initial download of the metrics may take a while.