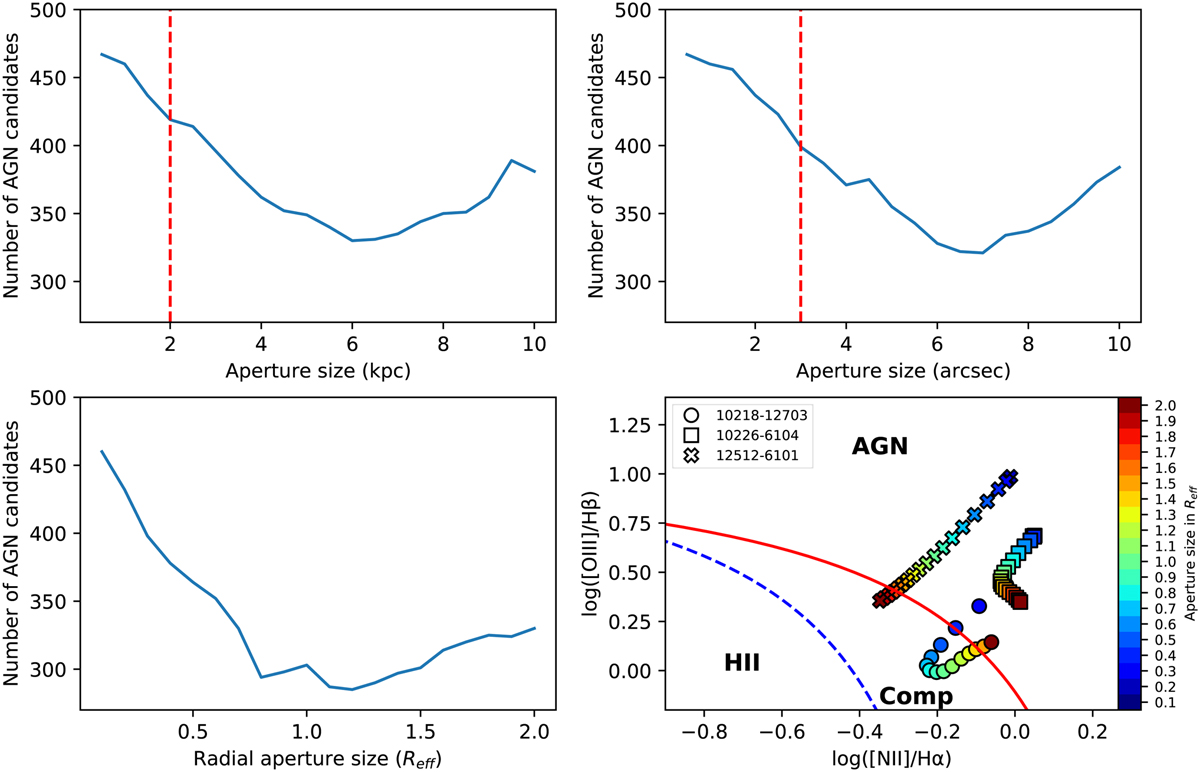
Fig. 2
Download original image
Variation in AGN classification with different aperture sizes. The y-axis in the top plots and the bottom left plot shows the number of galaxies classified as AGN (solid blue line) selected based on different aperture sizes and using different units. The selection is made following the algorithm described in Sect. 3.2, excluding the [O I]/Hα BPT diagram. In the top left plot, the kiloparsec aperture increases in steps of 0.5 kpc (in diameter). In the top right plot, the arcsecond aperture increases in steps of 0.5″ (in diameter). In the bottom left plot, the effective radius aperture increases in steps of 0.1 Reff (in radius). The red (vertical-dashed) line in the top panels corresponds to the apertures used for the comparisons in Sect. 5. In the bottom right plot, we show how the flux ratios in one BPT diagram change as a function of the aperture. This is done for three individual galaxies illustrated with different symbols (see the legend for their corresponding MaNGA-IDs). Each symbol is filled with a specific color that corresponds to the size of its aperture. In the bottom right plot, we also include the empirical division lines that will give each target a specific classification (e.g., AGN-like galaxy, composite object, or HII-star forming galaxies): red lines correspond to Kewley et al. (2001), and the blue dashed line on the left plot corresponds to Kauffmann et al. (2003a).
Current usage metrics show cumulative count of Article Views (full-text article views including HTML views, PDF and ePub downloads, according to the available data) and Abstracts Views on Vision4Press platform.
Data correspond to usage on the plateform after 2015. The current usage metrics is available 48-96 hours after online publication and is updated daily on week days.
Initial download of the metrics may take a while.