Fig. 10
Download original image
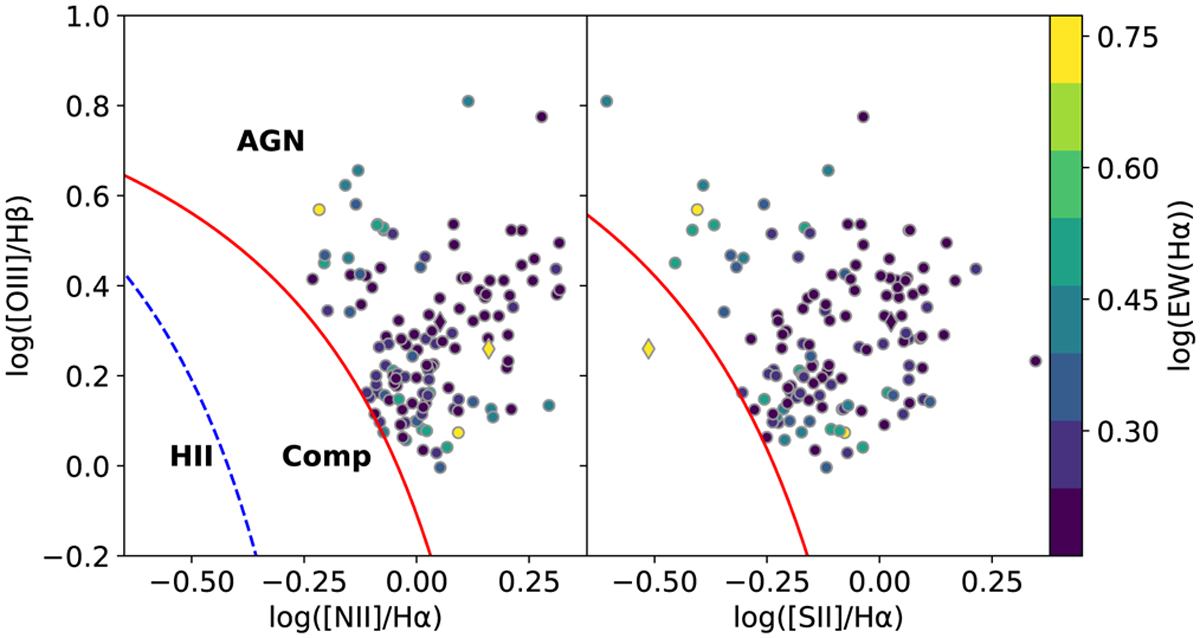
BPT position of all the AGN candidates that are in disagreement between our 3″ aperture catalog (without [OI]/Hα BPT diagram) and the catalog from Sánchez et al. (2016). Solid circles correspond to targets selected by our catalog but not by these latter authors. Solid diamonds correspond to the opposite situation (AGN-selected by Sánchez et al. 2016, but not by our catalog). The color on the scatter plots corresponds to the logarithmic EW(Hα). The red lines and the blue dashed line on the left plot correspond to Kewley et al. (2001) and Kauffmann et al. (2003a), respectively.
Current usage metrics show cumulative count of Article Views (full-text article views including HTML views, PDF and ePub downloads, according to the available data) and Abstracts Views on Vision4Press platform.
Data correspond to usage on the plateform after 2015. The current usage metrics is available 48-96 hours after online publication and is updated daily on week days.
Initial download of the metrics may take a while.