Fig. 1
Download original image
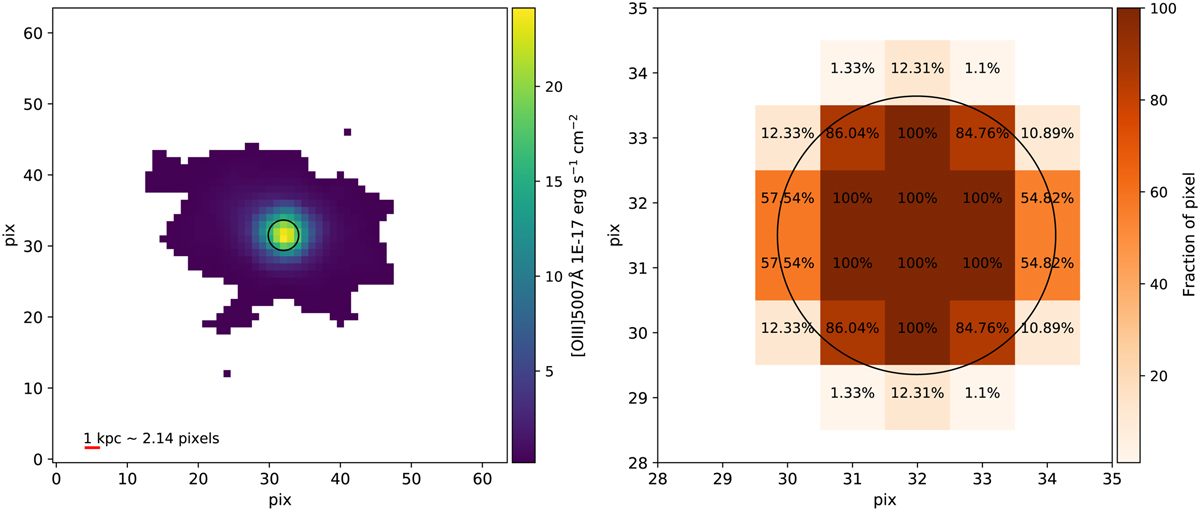
Example of our weighted pixel averaging. The left plot shows (target with plate-ifu: 8725-9102) the flux of the [OIII]λ5007 emission line. Pixels with S/N < 3 are masked. The black circle indicates the 2 kpc circular diameter aperture where we average the flux for the emission line ratios. The right plot shows a zoom onto the aperture region, showing the percentage of the pixel area captured by the aperture shown in black. We show the value in each pixel that corresponds to the weight of the pixel when we compute the average fluxes.
Current usage metrics show cumulative count of Article Views (full-text article views including HTML views, PDF and ePub downloads, according to the available data) and Abstracts Views on Vision4Press platform.
Data correspond to usage on the plateform after 2015. The current usage metrics is available 48-96 hours after online publication and is updated daily on week days.
Initial download of the metrics may take a while.