Open Access
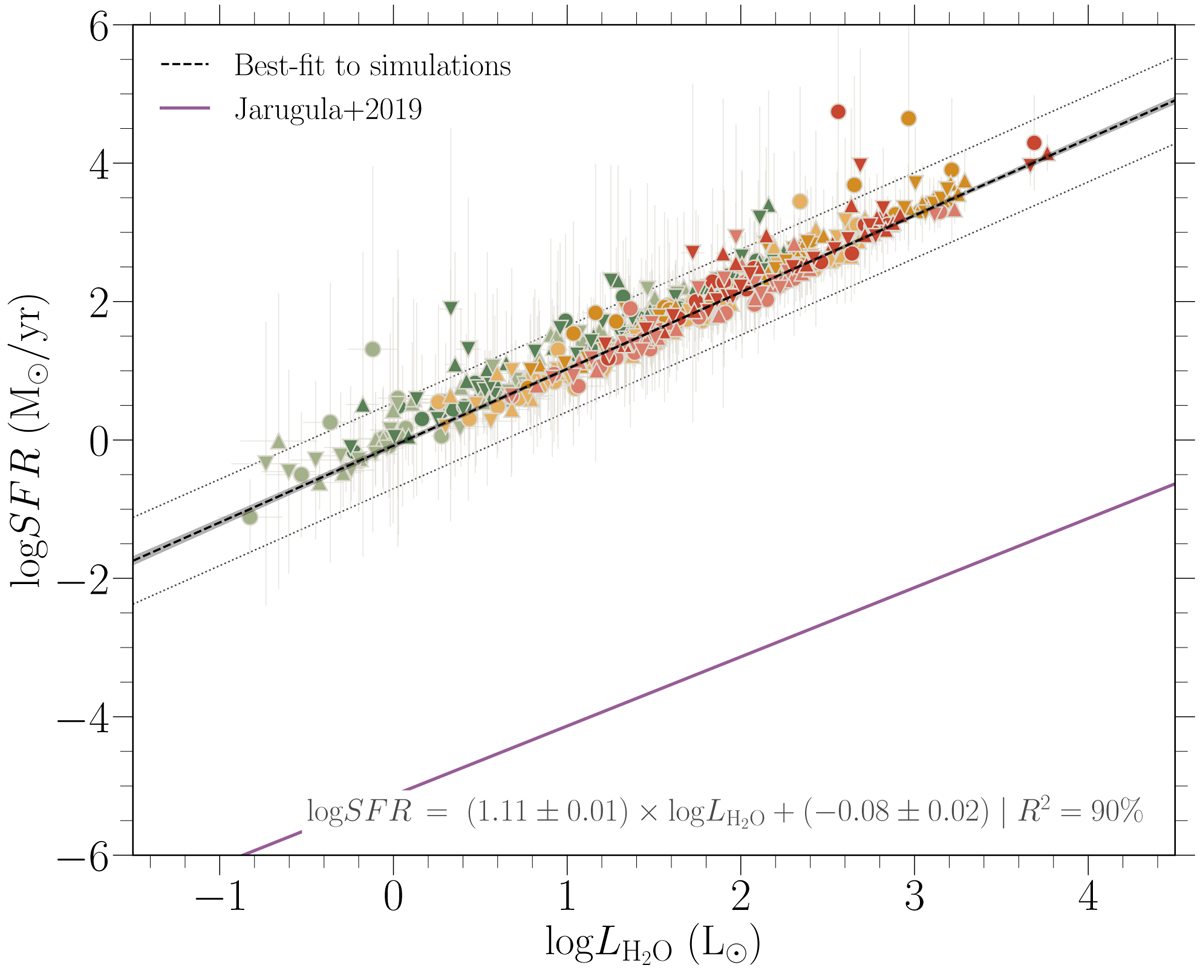
Fig. 6.
Download original image
SFR as a function of water line luminosity. Colors and markers are as in Fig. 3. The shaded region corresponds to the 95% confidence region of the correlation, while dotted lines indicate where 95% of the measurements should fall. The solid purple line represents the expected relation from Jarugula et al. (2019).
Current usage metrics show cumulative count of Article Views (full-text article views including HTML views, PDF and ePub downloads, according to the available data) and Abstracts Views on Vision4Press platform.
Data correspond to usage on the plateform after 2015. The current usage metrics is available 48-96 hours after online publication and is updated daily on week days.
Initial download of the metrics may take a while.