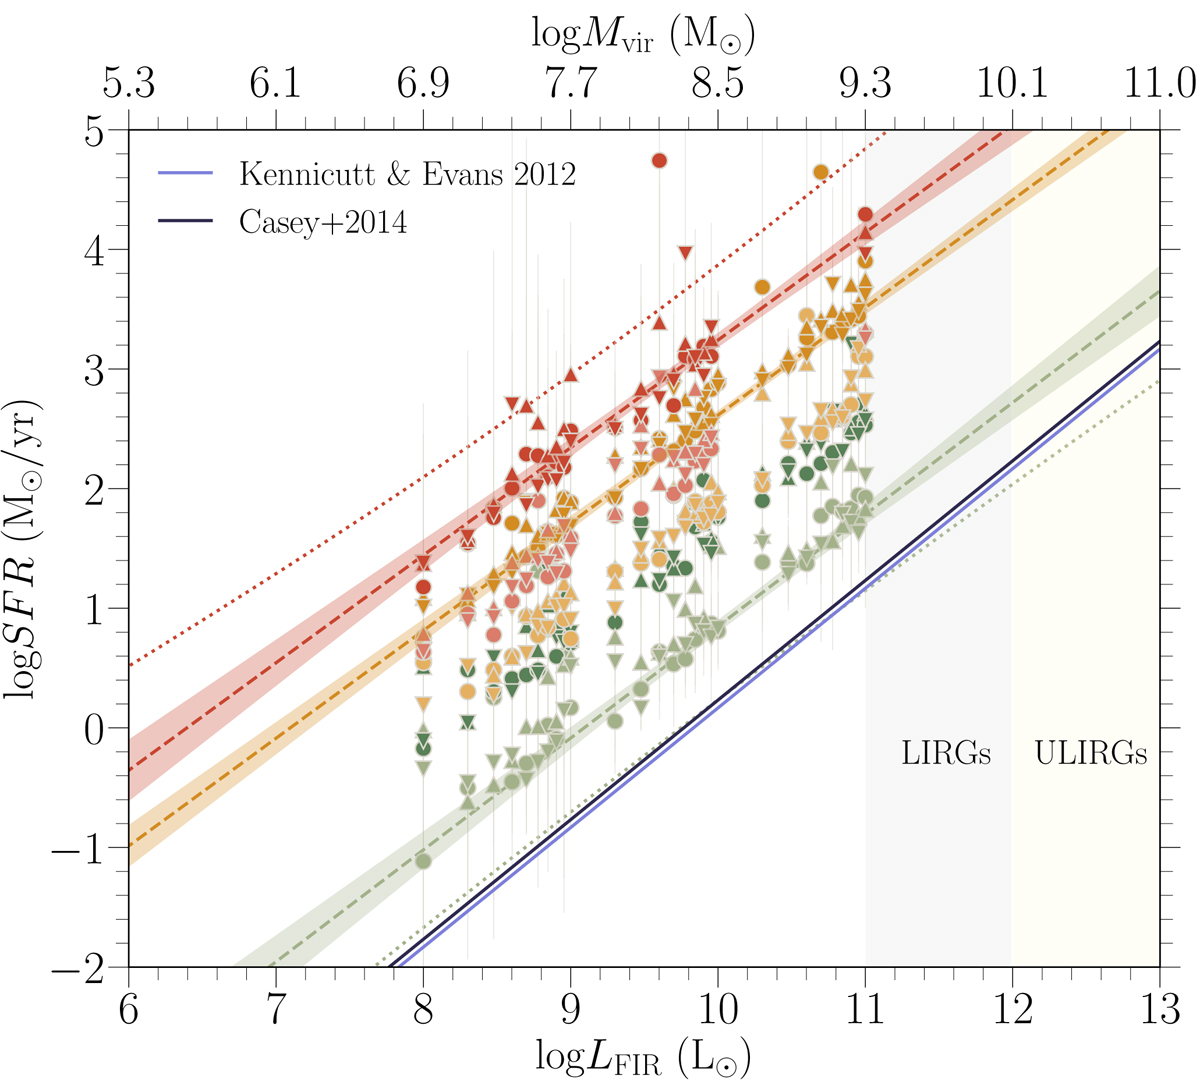
Fig. 5.
Download original image
SFR as a function of LFIR. Colors and markers as in Fig. 3. Dotted lines refer to the upper prediction band for the setup with the highest SFR and the lower prediction band for the setup with the lowest SFR. Shading of the best-fit lines corresponds to the 95% confidence region of each correlation. Solid lines represent the literature estimates.
Current usage metrics show cumulative count of Article Views (full-text article views including HTML views, PDF and ePub downloads, according to the available data) and Abstracts Views on Vision4Press platform.
Data correspond to usage on the plateform after 2015. The current usage metrics is available 48-96 hours after online publication and is updated daily on week days.
Initial download of the metrics may take a while.