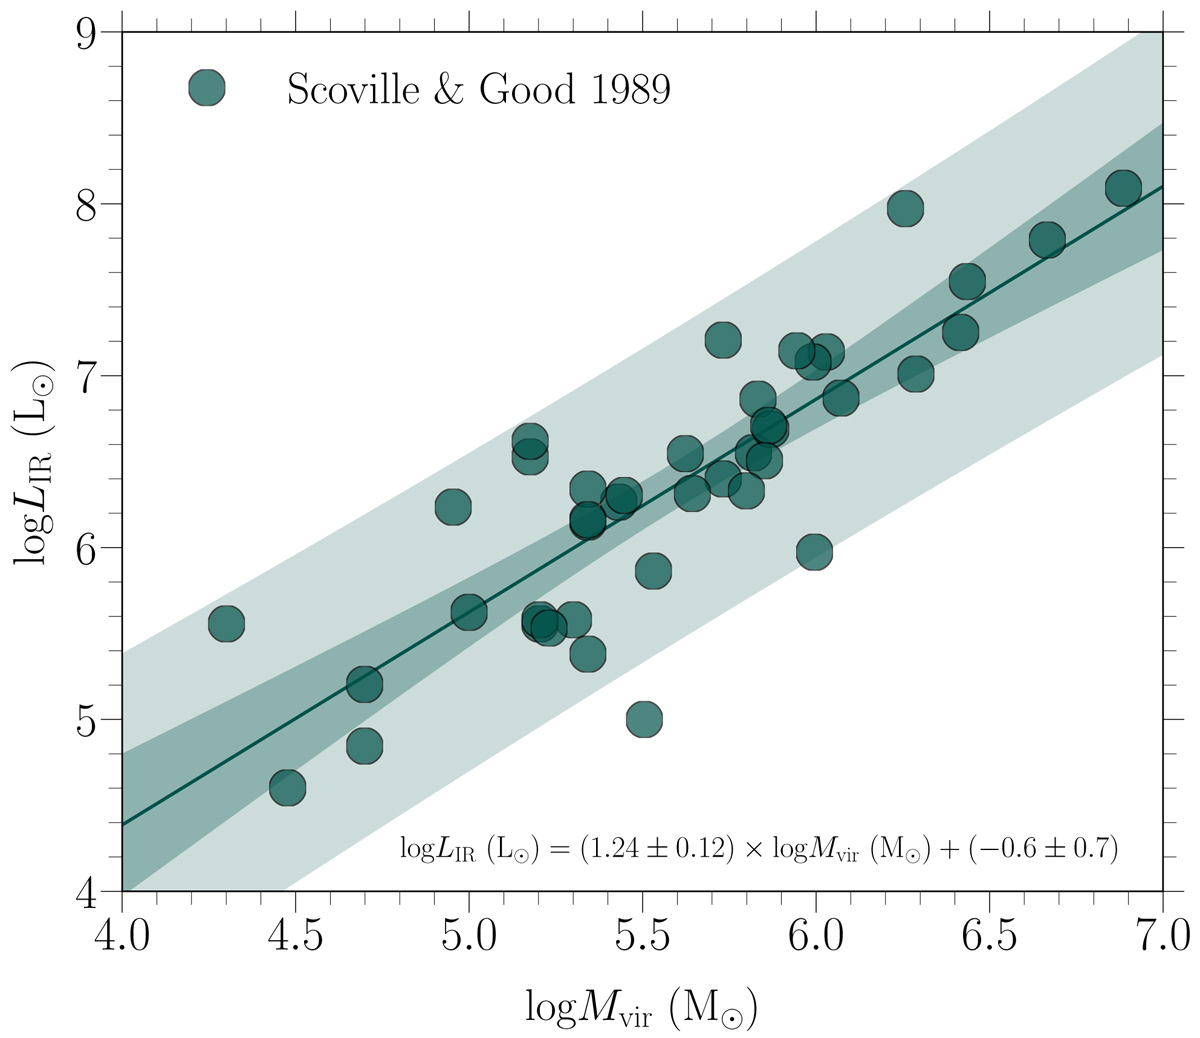
Fig. 1.
Download original image
Correlation between log Mvir and log LFIR following Scoville & Good (1989). The solid straight line represents the best-fit power law to the data points, the darker shaded region corresponds to the 95% confidence region of the correlation, and the lighter shaded region represents the region that contains 95% of the measurements.
Current usage metrics show cumulative count of Article Views (full-text article views including HTML views, PDF and ePub downloads, according to the available data) and Abstracts Views on Vision4Press platform.
Data correspond to usage on the plateform after 2015. The current usage metrics is available 48-96 hours after online publication and is updated daily on week days.
Initial download of the metrics may take a while.