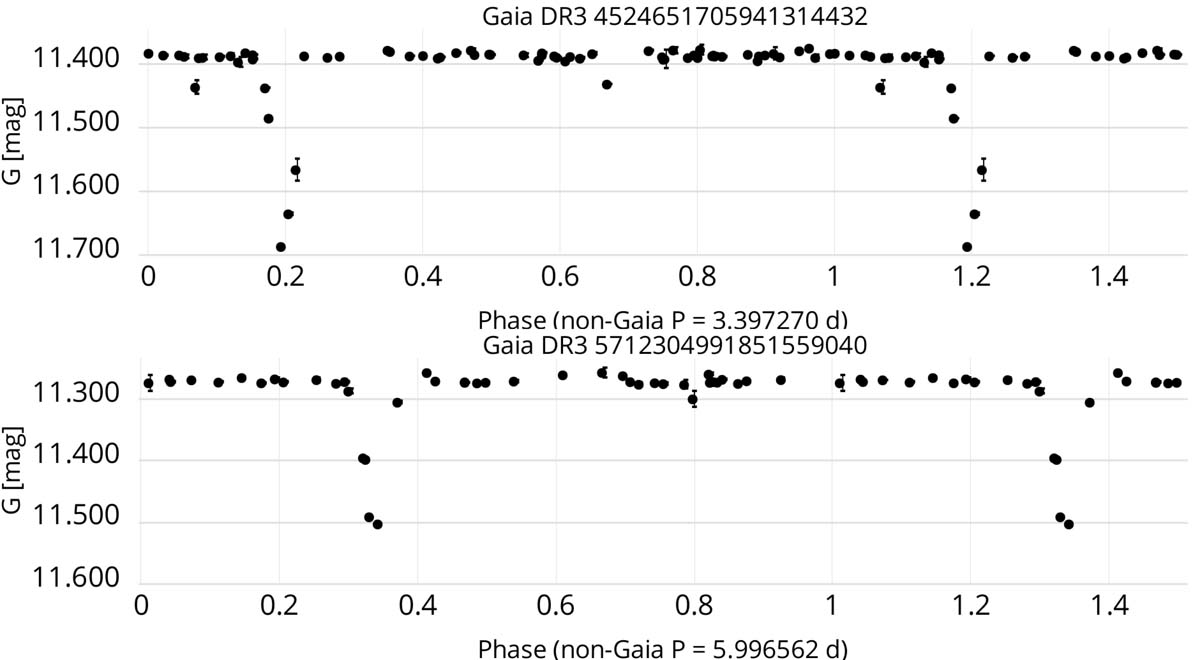
Fig. C.9.
Download original image
Light curves of Gaia DR3 4524651705941314432 and Gaia DR3 5712304991851559040 shown in Fig. 41 in the main body of the text, folded with the periods published by the ASAS-SN survey for the respective cross-matches (ASASSN-V J075432.26-211826.4 with P = 3.3972697 d, and ASASSN-V J184156.16+192755.8 with 5.9965616 d, respectively).
Current usage metrics show cumulative count of Article Views (full-text article views including HTML views, PDF and ePub downloads, according to the available data) and Abstracts Views on Vision4Press platform.
Data correspond to usage on the plateform after 2015. The current usage metrics is available 48-96 hours after online publication and is updated daily on week days.
Initial download of the metrics may take a while.