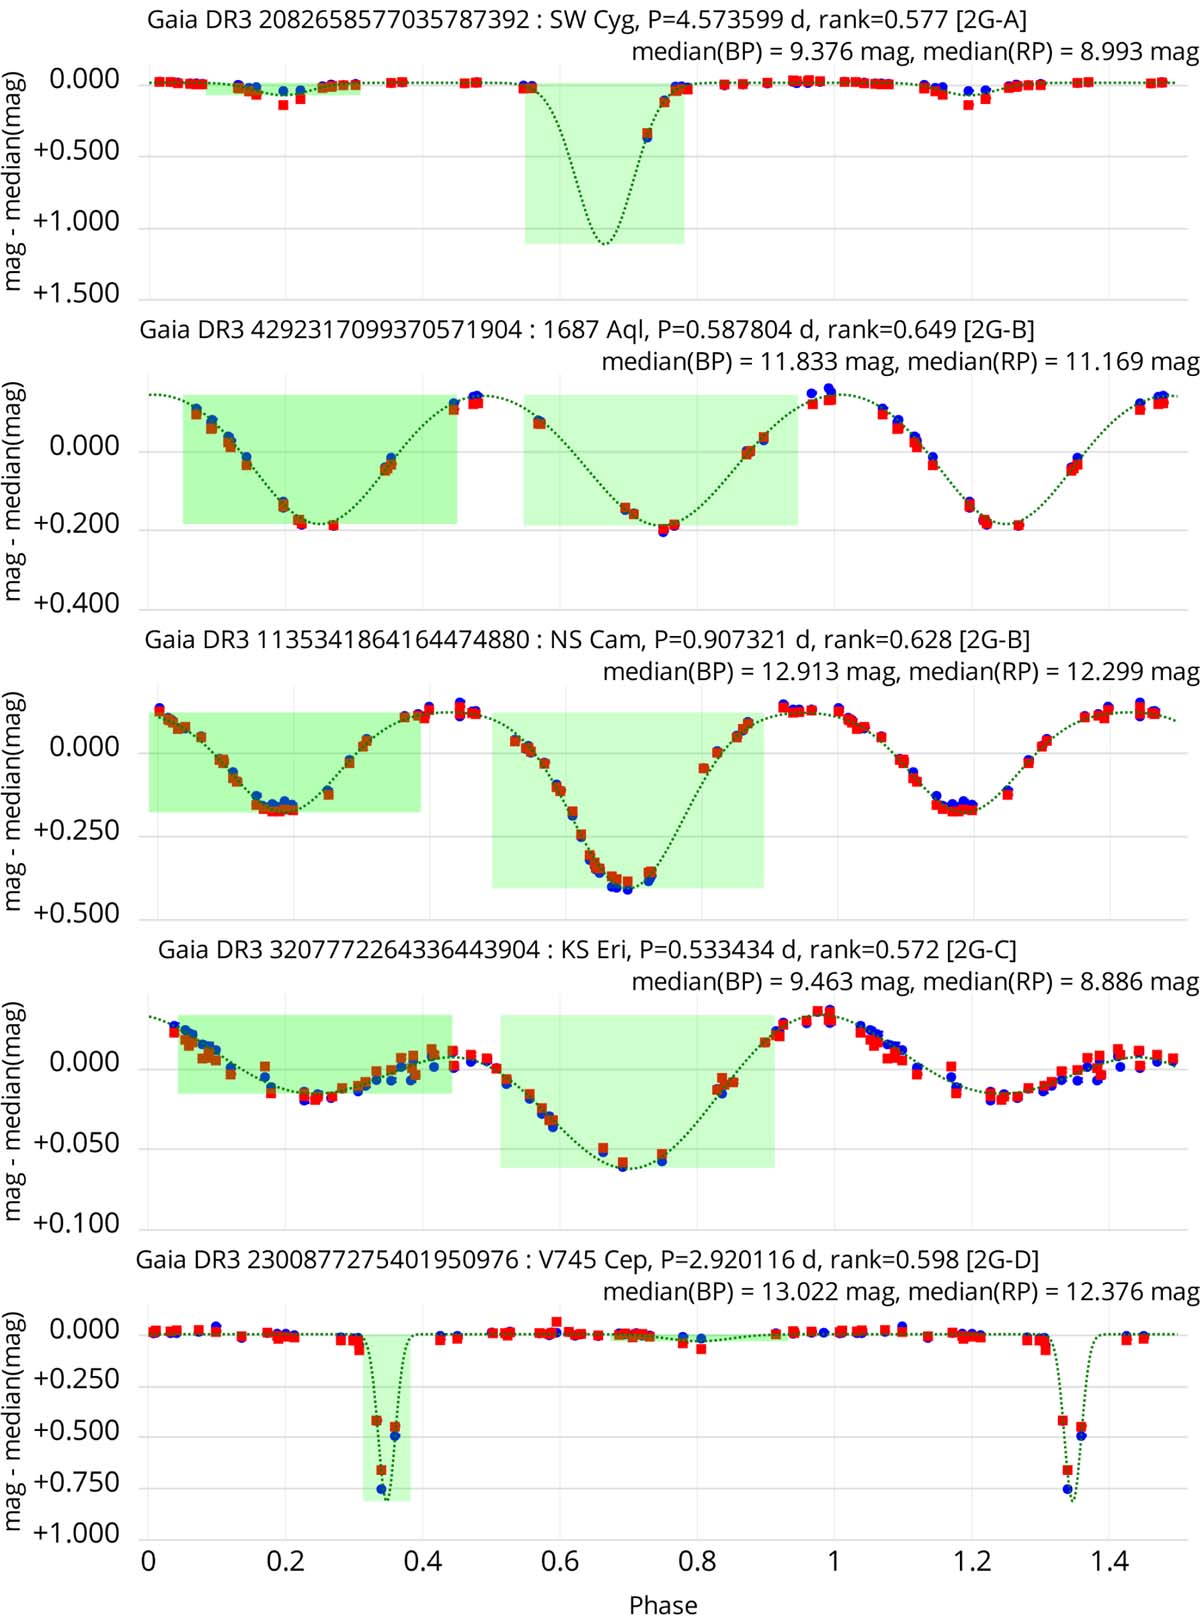
Fig. C.1.
Download original image
GBP and GRP folded light curves of the eclipsing binaries whose G are shown Fig. 5 in the main body of the article. The GBP and GRP magnitudes are shifted by a value equal to the median magnitudes of their respective light curves, given in the top of each panel. The dotted line represents the two-Gaussian models determined from the G light curves, with the green areas indicating the derived eclipse durations.
Current usage metrics show cumulative count of Article Views (full-text article views including HTML views, PDF and ePub downloads, according to the available data) and Abstracts Views on Vision4Press platform.
Data correspond to usage on the plateform after 2015. The current usage metrics is available 48-96 hours after online publication and is updated daily on week days.
Initial download of the metrics may take a while.