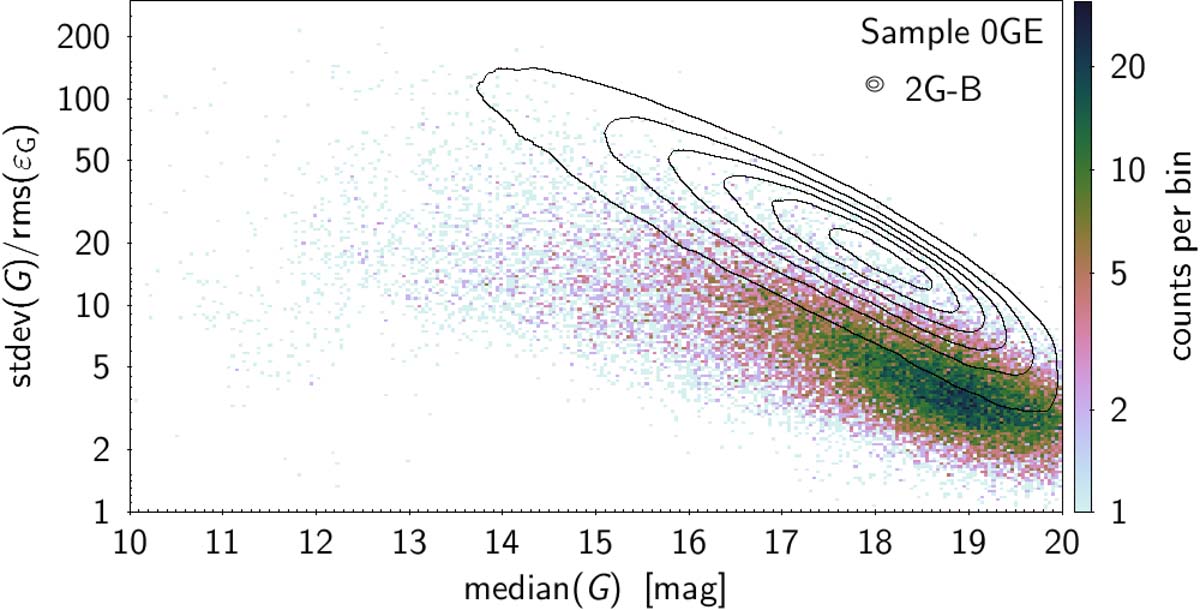
Fig. A.23.
Download original image
Density map of the S/N (computed as the ratio of the standard deviation over the root-mean-square of the G magnitude uncertainties) versus G magnitude for the sample of candidates modelled with only a cosine function (Sample 0GE). The contours delineate the density of sources in the sample 2GE-B (modelled with two Gaussians and an ellipsoidal component with large amplitude (see text). Six contours are shown on a linear scale of the density of sources on the map.
Current usage metrics show cumulative count of Article Views (full-text article views including HTML views, PDF and ePub downloads, according to the available data) and Abstracts Views on Vision4Press platform.
Data correspond to usage on the plateform after 2015. The current usage metrics is available 48-96 hours after online publication and is updated daily on week days.
Initial download of the metrics may take a while.