Fig. A.20.
Download original image
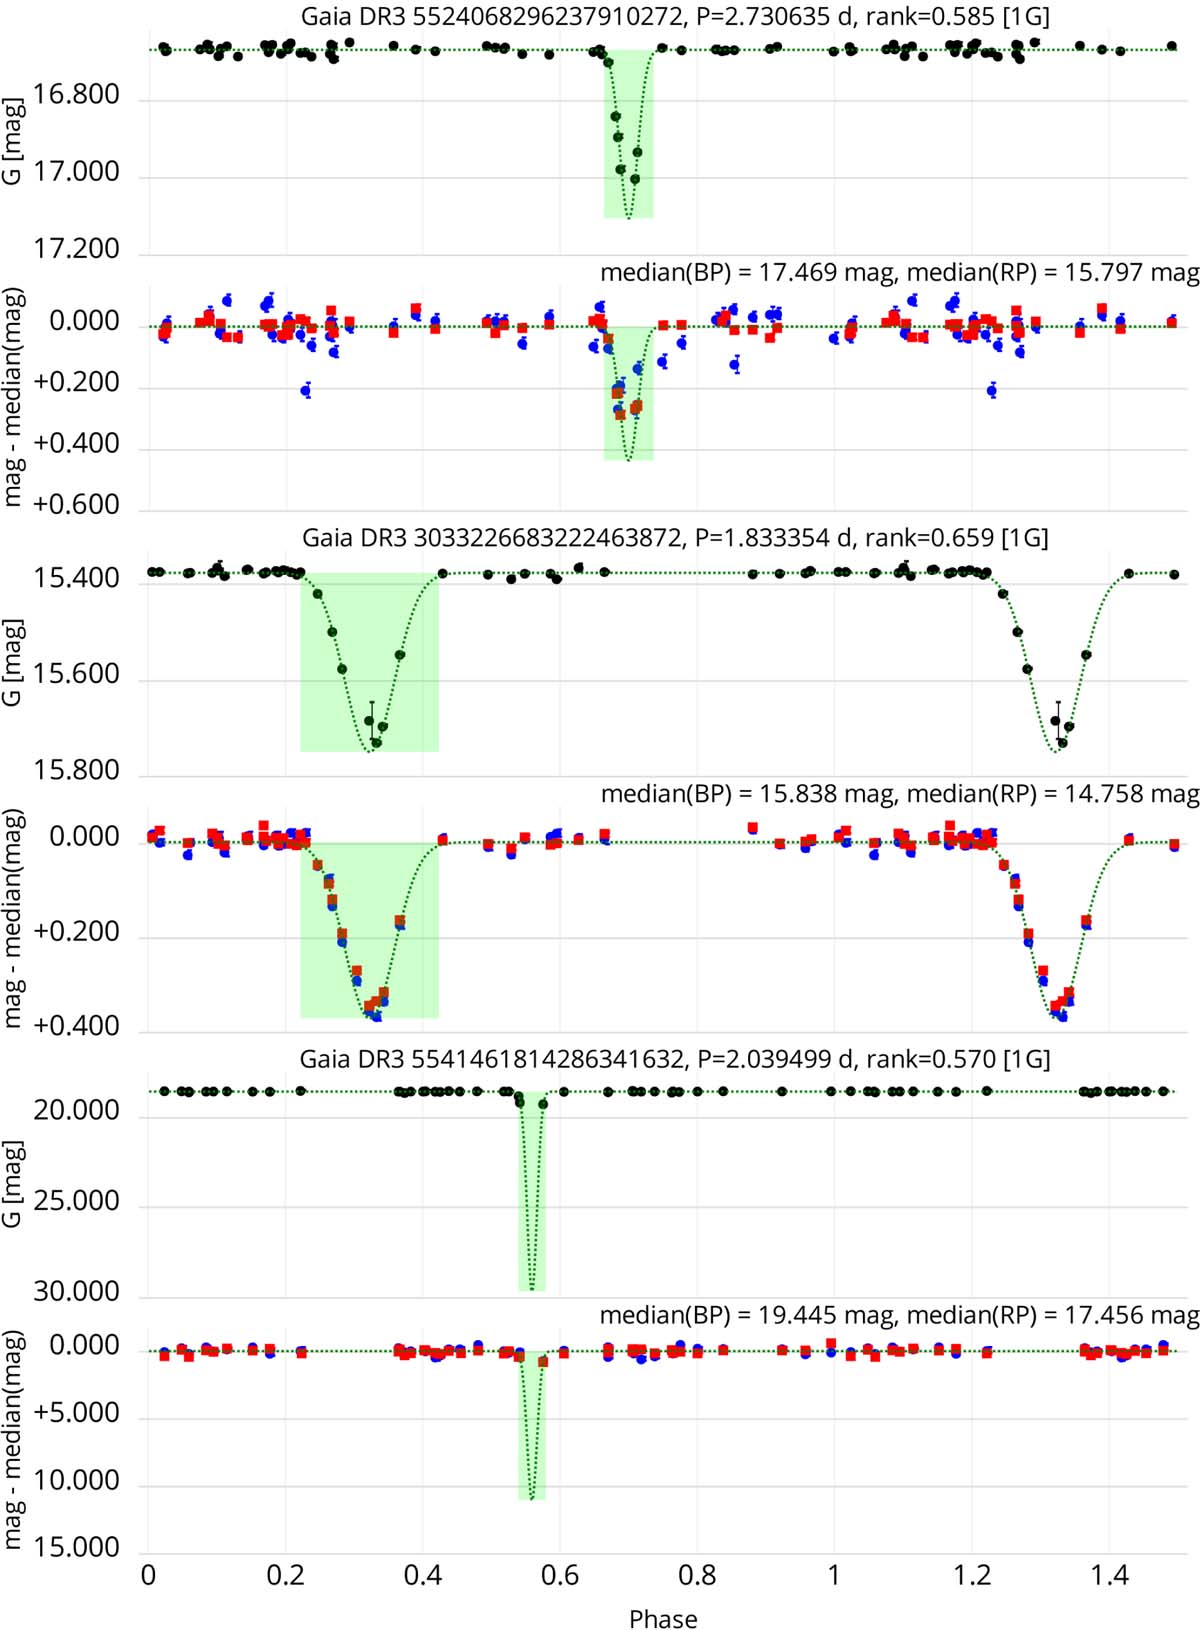
Same as Fig. A.3, but for three candidates in Sample 1G of light curves modelled with only one Gaussian. The top set (Gaia DR3 5524068296237910272) shows a case where the period is probably a factor of two too small, the second set (Gaia DR3 3033226683222463872) shows a case where observation may be missing at the phase window of the second eclipse, and the third case (Gaia DR3 5541461814286341632) illustrates a case where the lack of sufficient phase coverage within an eclipse leads to an overestimation of the eclipse depth.
Current usage metrics show cumulative count of Article Views (full-text article views including HTML views, PDF and ePub downloads, according to the available data) and Abstracts Views on Vision4Press platform.
Data correspond to usage on the plateform after 2015. The current usage metrics is available 48-96 hours after online publication and is updated daily on week days.
Initial download of the metrics may take a while.